Articles
Income and Expense Worksheet: A Complete Guide (2026)
If your business finances live across bank feeds, email threads, portal downloads, and a pile of receipts on your desk, you’re not alone. Most owners don’t struggle with the idea of tracking money. They struggle with turning scattered transactions into one clean, reliable record they can use.
That’s where an income and expense worksheet earns its keep. It’s simple on purpose. One place to log what came in, what went out, and whether the business is creating a surplus or drifting into a cash squeeze. For a new business owner, that worksheet is often the first tool that turns guesswork into something manageable.
Why Your Business Needs Financial Clarity Now
A lot of owners can answer “Are sales coming in?” and “Are bills getting paid?” Far fewer can answer “Which costs are rising?”, “What did the business keep last month?”, or “Which income source is pulling the most weight?” Those are different questions. They need records, not memory.
An income and expense worksheet gives you that record. It tracks earnings against expenditures so you can see your net position, spot patterns, and make budgeting decisions before small issues become expensive ones. That’s why these worksheets have stuck around for so long. This way of recording money goes back to early personal finance education, and modern spreadsheet templates became widely accessible in the 2000s. Used consistently, they’re associated with better outcomes. US households using worksheets report 15-20% better savings rates, according to Vertex42’s overview of income and expense worksheets.
Practical rule: If you can’t tell me your monthly net result from one document, you don’t have financial clarity yet.
For a business owner, the relief is immediate. Once the numbers sit in one worksheet, you stop checking three different apps to answer one basic question. You can see whether client payments are covering software, payroll, rent, contractor costs, and tax set-asides. You can also stop treating every busy month as a good month. Busy and profitable aren’t the same thing.
If you want a broader companion resource for building the habit of consistent tracking, Senki’s guide to personal finance tracking is useful because it reinforces the same principle that applies in business. Clear records create better decisions.
What the worksheet actually does
An effective worksheet helps you do three things well:
- Track income clearly so sales, service revenue, and other business receipts don’t blur together
- Track expenses consistently so recurring and one-off costs both show up in the right period
- Calculate the gap between the two, which tells you whether the business is generating room to grow or creating pressure you need to address
That’s the foundation. Everything else, including reporting and forecasting, depends on getting this part right.
Building Your First Income and Expense Worksheet
Start in Google Sheets or Excel. Don’t overcomplicate the first version. A clean worksheet beats a clever one every time.

Create three tabs:
- Income
- Expenses
- Summary
That structure matters. Separate tabs reduce clutter and make formulas easier to audit later. Dedicated sheets for income and expenses are also the recommended starting point in spreadsheet-based budgeting workflows. To reduce messy coding, use dropdown lists for categories. Inconsistent categorization causes 45% of tracking errors according to bookkeeping benchmarks cited by SimplePractice’s spreadsheet guide.
Set up the Income tab
Your Income tab should include these columns:
- Date
- Customer or Source
- Description
- Income Type
- Amount
- Tax
- Net
- Payment Status
- Notes
The basic formula for Net is simple. If Amount is in column E and Tax is in column F, your formula is =E2-F2.
Use a dropdown for Income Type. Keep it short and specific. For most small businesses, categories like Sales, Client Payment, Freelance, Retainer, Refund, and Other Income are enough.
Set up the Expenses tab
Your Expenses tab should mirror the structure of the Income tab, but with expense-specific fields:
- Vendor
- Category
- Payment Method
- Paid Status
The key choice here is your Category list. Don’t invent a new label every time you buy something. “Google Ads,” “Meta ads,” and “flyer printing” can all sit under Marketing if that’s how you want to review spending.
Here’s a practical starter list.
Category Group
Example Expenses
Operations
Rent, utilities, internet, office supplies
Software
Google Workspace, Microsoft, bookkeeping apps, design tools
Marketing
Ads, email platforms, printing, sponsorships
Cost of Sales
Materials, packaging, subcontractors tied to delivery
Travel
Mileage, parking, trains, hotels
Professional Services
Accountant, lawyer, consultant
Banking and Fees
Payment processor fees, bank charges
Owner Draw and Personal
Transfers to owner, non-business spending kept separate
If you need a supporting document for employee claims or reimbursable purchases, a free expense report template can help standardize what gets submitted before it lands in the worksheet.
Build the Summary tab
The Summary tab should answer the questions you ask most often. Keep these cells visible:
- Total Income
- Total Expenses
- Net Income
- Largest Expense Category
- Unpaid Invoices
- Outstanding Bills
The formulas can stay basic at first:
- Total Income:
=SUM(Income!E:E) - Total Expenses:
=SUM(Expenses!E:E) - Net Income:
=Total Income - Total Expenses
A worksheet only helps if it’s easy to read. Use conditional formatting to flag negative values in red and overdue items in a separate color. Add data validation to your category columns so no one types freehand alternatives that break reporting.
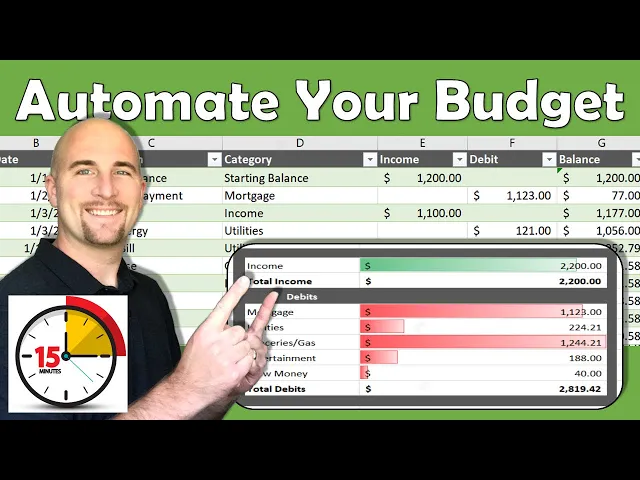
A quick visual walkthrough helps if this is your first build:
Keep the first version boring. Fancy dashboards can wait. Clean categories and reliable totals matter more.
A few setup choices that work well
- Use one file per year if you want cleaner archives and easier review
- Name tabs by month only if volume is high. Otherwise, one Income tab and one Expenses tab for the year is usually easier to manage
- Lock formula cells so accidental edits don’t corrupt totals
- Add a notes field because odd transactions always need context later
That gives you a functional income and expense worksheet you can start using today.
Best Practices for Logging Income and Expenses
The worksheet structure is the easy part. The discipline is where most businesses slip.
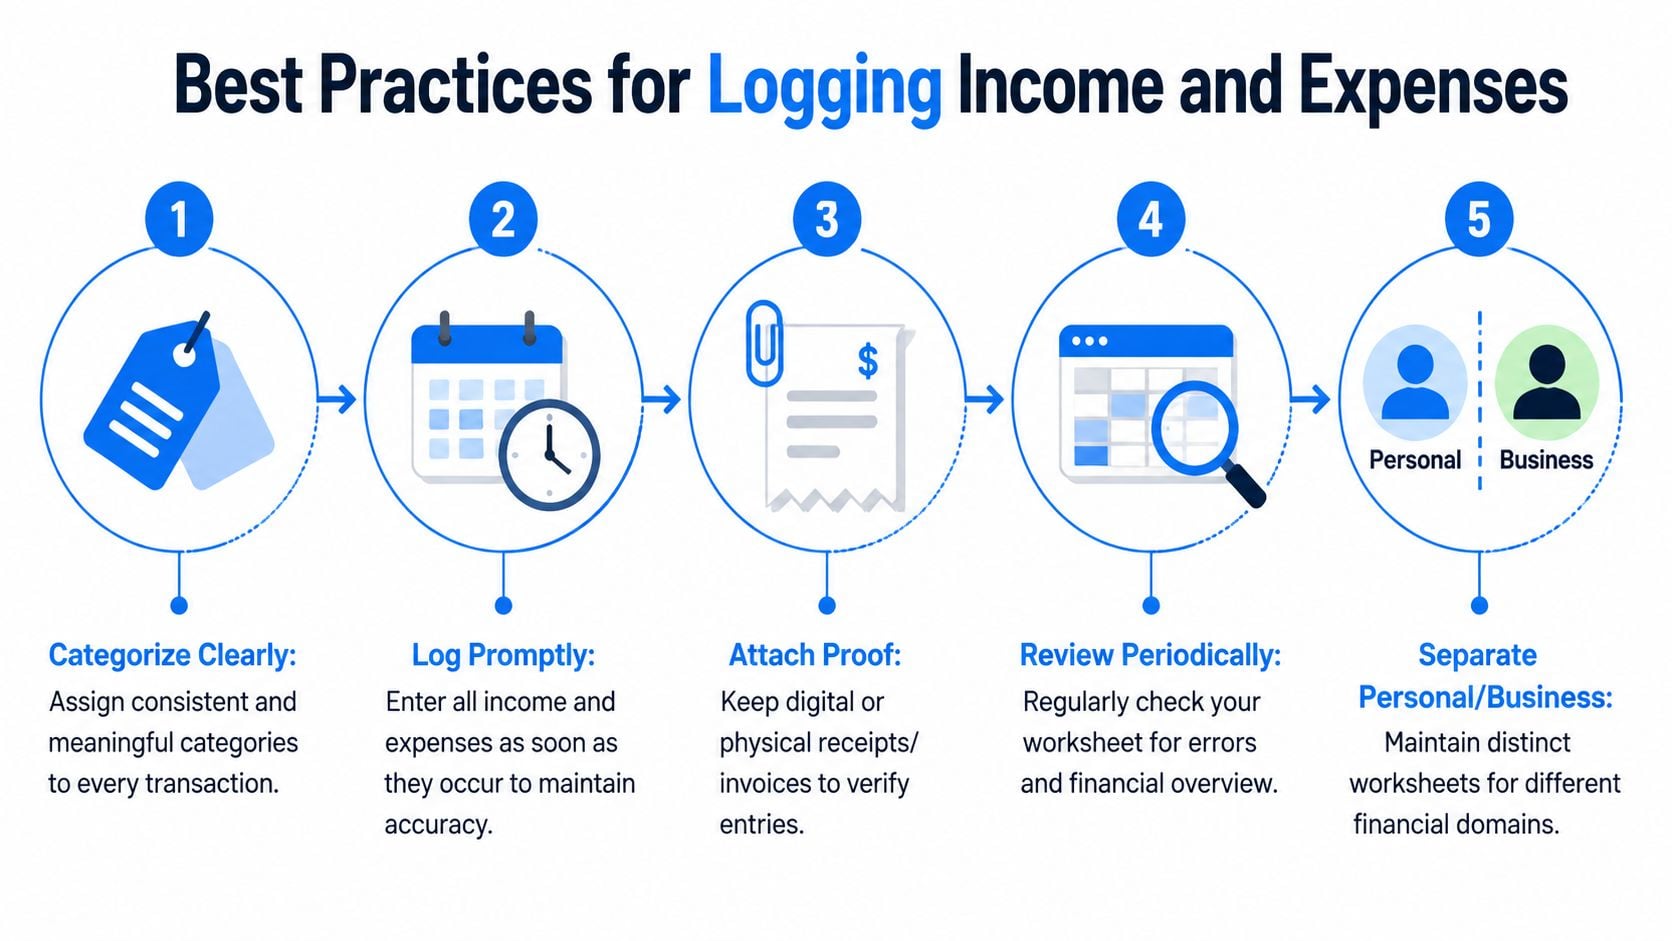
Good records come from a repeatable flow. A client pays through Stripe, a supplier emails an invoice, someone buys packing materials with a card, a recurring software charge hits overnight. Each of those needs to land in the worksheet the same way every time, or the sheet stops being trustworthy.
Log from source documents, not memory
Use the original record whenever possible:
- Client payment received from Stripe. Log the payment date, client name, amount, fee if you track it separately, and mark whether the invoice is fully settled.
- Monthly software subscription. Enter the vendor, billing period, category under Software, and note whether it renews automatically.
- One-off equipment purchase. Record the vendor, item description, and keep the receipt attached digitally or filed physically.
- Retail sale or direct sale. Summarize daily or weekly if transaction volume is high, but use a consistent method.
The biggest mistake I see is delayed entry. Owners wait until month end, then try to reconstruct what happened from bank feeds and scattered email receipts. That turns a basic admin task into detective work.
Enter transactions while the context is still fresh. You’ll classify them faster, and you’ll make fewer corrections later.
Keep proof attached to the entry
Your worksheet should never stand alone. Every line should point back to something real: an invoice, receipt, order confirmation, bank record, or payment notification.
That matters in any organization, not just a standard small business. If you work with designated funds, grants, or restricted spending, the discipline is even tighter. Grain’s piece on managing church funds effectively is a good example of how recordkeeping and fund separation protect the integrity of the numbers.
Build a routine that survives busy weeks
A good workflow is one you’ll still follow when business gets hectic. The easiest routines usually look like this:
- Daily check for incoming documents so invoices and receipts don’t pile up in your inbox
- Scheduled worksheet update on the same day each week
- End-of-month review against your bank and card statements
- Separate personal and business entries so owner spending doesn’t muddy operating results
You don’t need perfect timing. You need consistency.
Use the same category language every time
“Fuel,” “car expense,” and “travel” might all describe the same type of spend. Pick one category system and stick to it. If you want more detail, use the description field, not a new category name.
A useful compromise is to keep categories broad and descriptions specific. That gives you cleaner reporting without losing detail. “Marketing” as the category and “Google Ads April campaign” as the description is much more useful than inventing a new category for every platform.
From Data Entry to Business Intelligence
Once your worksheet has a few weeks of real activity in it, it stops being just a record of the past. It becomes a decision tool.
The first job is reconciliation. Match the worksheet against your bank statements, card statements, and payment platform records. If a payment hit the bank but not the sheet, the sheet is incomplete. If the sheet shows an expense that never cleared, you need to investigate before using that data to make decisions.
Turn the worksheet into a dashboard
A good summary tab doesn’t need to be flashy. It needs to answer useful questions fast.

For categorized totals, use SUMIFS. For example, =SUMIFS(Expenses!Amount,Expenses!Category,"Marketing") gives you one category total without filtering the whole sheet. Add a few KPI cells on top of the dashboard, including Profit Margin, which you can calculate as =(Net/Income)*100. According to FinancialAha’s worksheet guidance, auto-updating formulas achieve 92% accuracy in projections, versus 65% for manual calculation.
That gap matters because projection errors usually don’t look dramatic at first. They show up as confidence in numbers that were never updated properly.
Reports worth checking each month
A few simple views carry most of the value:
Report
What it tells you
Monthly net income
Whether the business kept more than it spent
Expense by category
Where money is actually going
Projected vs actual
Whether your assumptions matched reality
Unpaid income
Which receivables still need follow-up
A worksheet becomes useful when it helps you decide what to change next month, not when it merely proves what happened last month.
What to look for in the numbers
Read the worksheet like an operator, not just a recordkeeper.
If one category keeps climbing, ask whether the spend is intentional or just unmanaged. If income is strong but net income is weak, review variable costs before you chase more sales. If projected figures and actuals drift apart repeatedly, your pricing, payment timing, or expense assumptions probably need work.
This is also where monthly variance analysis helps. Keep a simple table with Projected, Actual, and Variance so you can see where assumptions are too optimistic or too loose. You don’t need advanced finance software to do this well. You need a worksheet that’s current and formulas you can trust.
Common Mistakes That Make Your Worksheet Useless
Most broken worksheets don’t fail because the math is hard. They fail because the habits behind them are sloppy.
The first problem is inconsistent categorization. If you log one ad payment under Marketing this month and Advertising next month, your category totals stop meaning anything. You’ll still have numbers, but they won’t answer the question you think you’re asking.
The errors that quietly ruin the sheet
- Mixing personal and business spending. This makes operating costs look higher or lower than they really are.
- Forgetting cash or card purchases. Small missed expenses add up and distort category totals.
- Ignoring one-off costs. Annual renewals, setup fees, and equipment purchases can surprise you if you only focus on recurring bills.
- Breaking formulas. One overwritten total cell can throw off the whole summary without any obvious warning.
- Letting the sheet go stale. A clean worksheet that’s six weeks behind is just a historical artifact.
One of the worst habits is trusting the summary without checking the inputs. Owners often look at the dashboard, not the rows feeding it. If the source lines are inconsistent, the dashboard only gives you polished confusion.
The simple fixes
Use dropdown categories. Lock formula cells. Reconcile on a schedule. Keep source documents. Separate owner spending from business expenses every single time.
If a transaction makes you stop and wonder where to put it, your category system needs work before your spreadsheet needs more formulas.
Also, don’t chase perfect detail at the expense of usable records. A practical worksheet with stable categories beats an elaborate sheet that no one keeps updated. Precision matters, but consistency matters first.
Automate Your Data Collection with Booksmate
The spreadsheet is not the hard part anymore. Collecting the data is.
That’s the bottleneck for growing businesses and for the bookkeepers who support them. You can build a clean income and expense worksheet in an afternoon. The drain starts when invoices live inside Amazon, Stripe, PayPal, Google, Microsoft, vendor portals, and dozens of inbox threads.
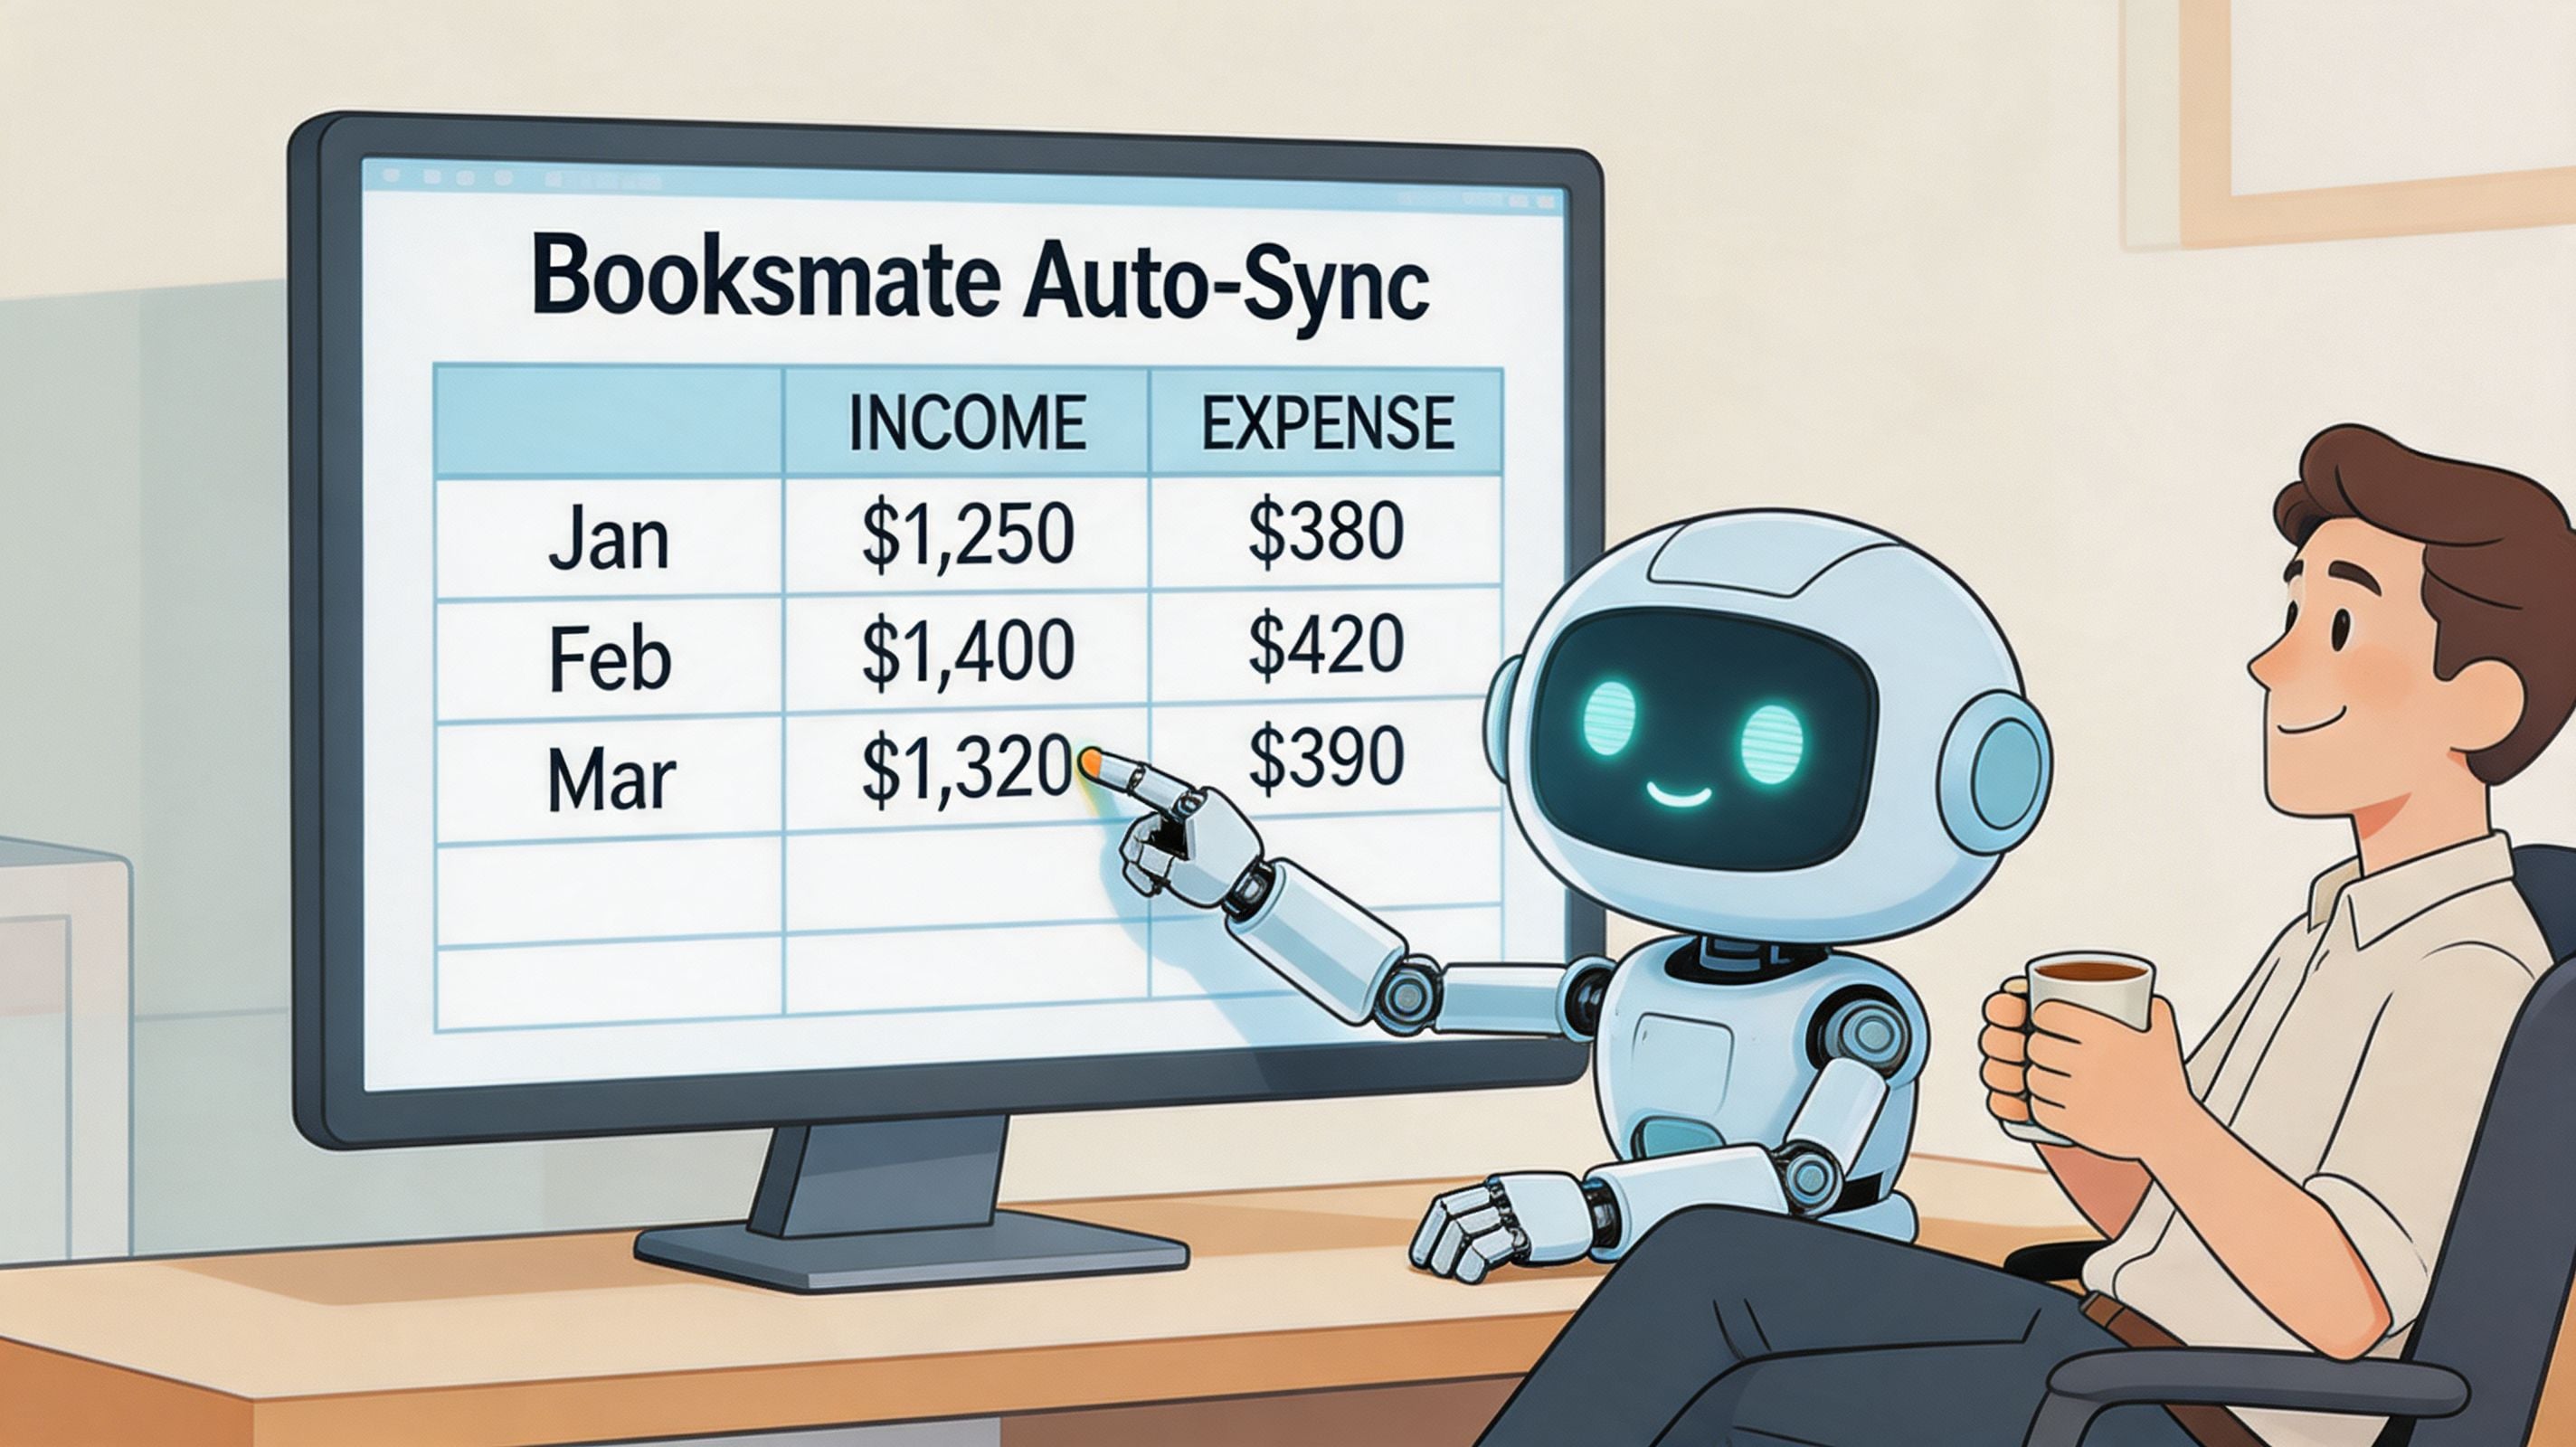
Most traditional worksheet advice still assumes someone will manually download documents, rename files, open each one, pull out the vendor, date, tax, and amount, then enter it by hand. That method can work at low volume. It breaks down fast when the business grows.
A major gap in older worksheet workflows is handling digital invoice volume. 68% of small businesses spend over 10 hours weekly on manual invoice handling, and automation tools like Booksmate can reduce that manual entry by up to 85% by connecting directly to portals like Amazon, Stripe, and PayPal to fetch documents automatically, according to Money Management’s worksheet-related resource.
What an automated workflow changes
Instead of building your process around chasing paperwork, you build it around review.
- Documents are fetched automatically from supported portals and inboxes
- Key fields are extracted so the important details are ready for sorting and export
- Your worksheet becomes a review layer instead of a manual typing project
- Bookkeepers spend more time checking accuracy and less time hunting for files
That’s the better division of labor. Let software gather and extract. Let humans review, classify, and decide.
The spreadsheet still matters
Automation doesn’t make the income and expense worksheet obsolete. It makes it more useful.
You still need the worksheet to review totals, compare categories, monitor net income, and prepare for tax and reporting discussions. What changes is the path the data takes to get there. Instead of copying from PDFs and portals one line at a time, you start with cleaner inputs.
For business owners, that means fewer admin hours and a more current picture of the business. For bookkeepers, it means a workflow that scales without turning every month-end close into a document chase.
If you’re tired of downloading invoices one portal at a time, Booksmate is worth a serious look. It automates invoice and receipt collection from portals and inboxes, extracts the key data with AI, and gives you organized records that are far easier to feed into your accounting workflow or income and expense worksheet.