Invoice Management Statistics 2026: Cost, Exceptions, Cycle Time & Where Invoices Hide
Invoice management statistics 2026: Ardent Best-in-Class $2.78 vs All Others $12.88, 9% vs 22% exceptions, 3.1 vs 17.4 days, primary sources, portal/email capture gap.

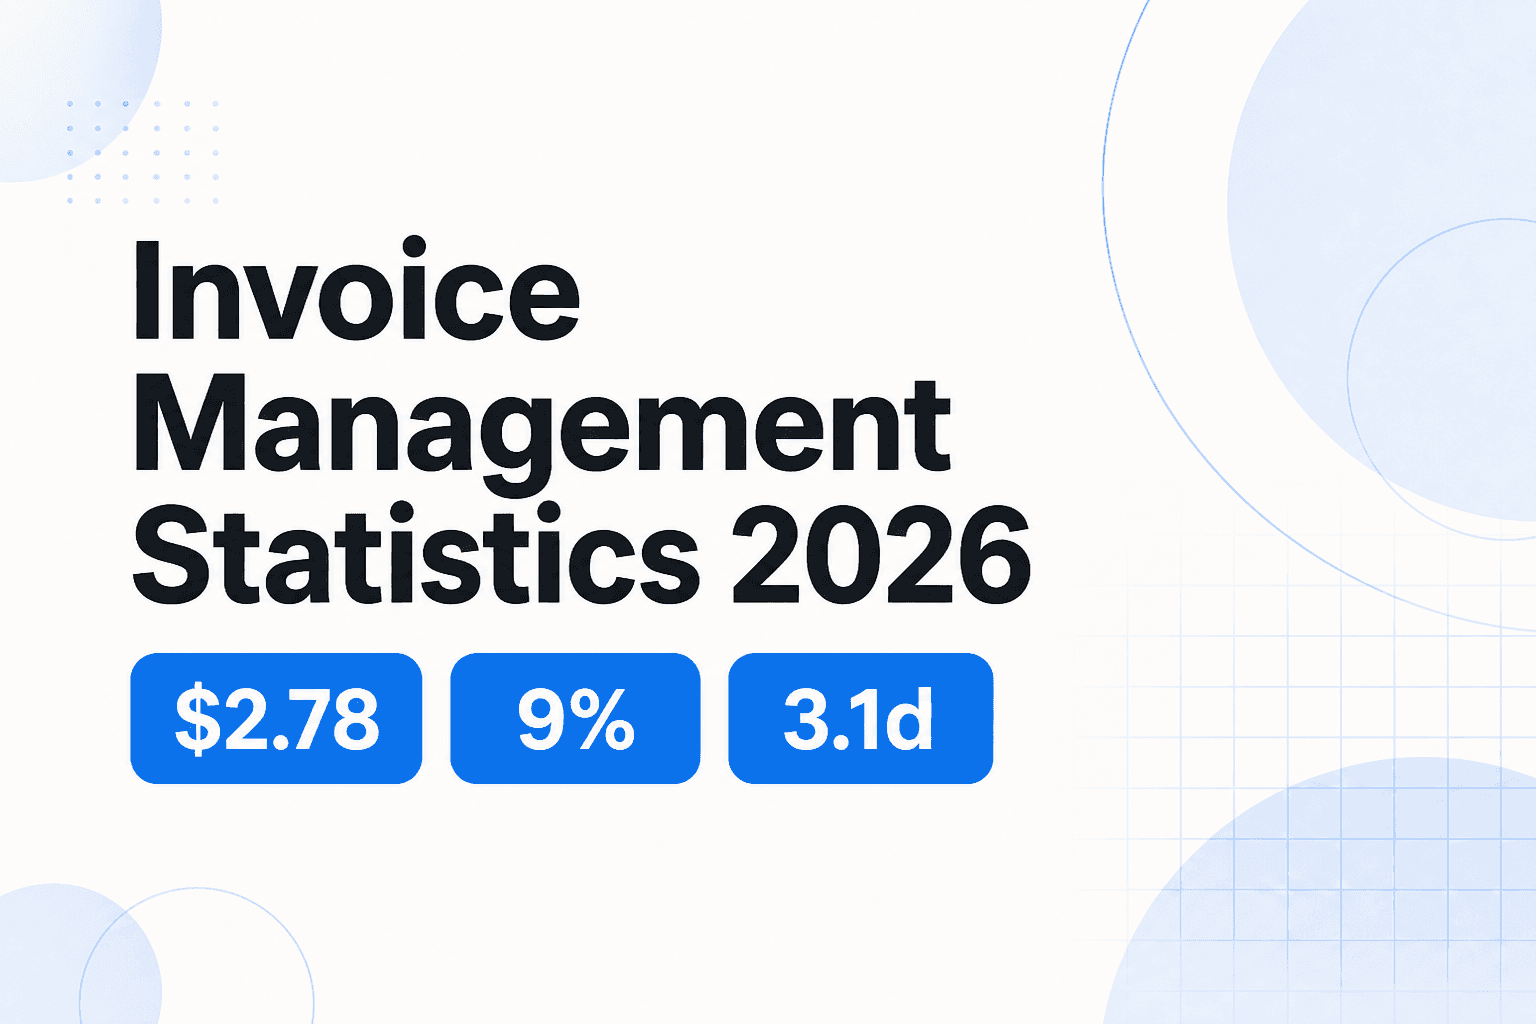
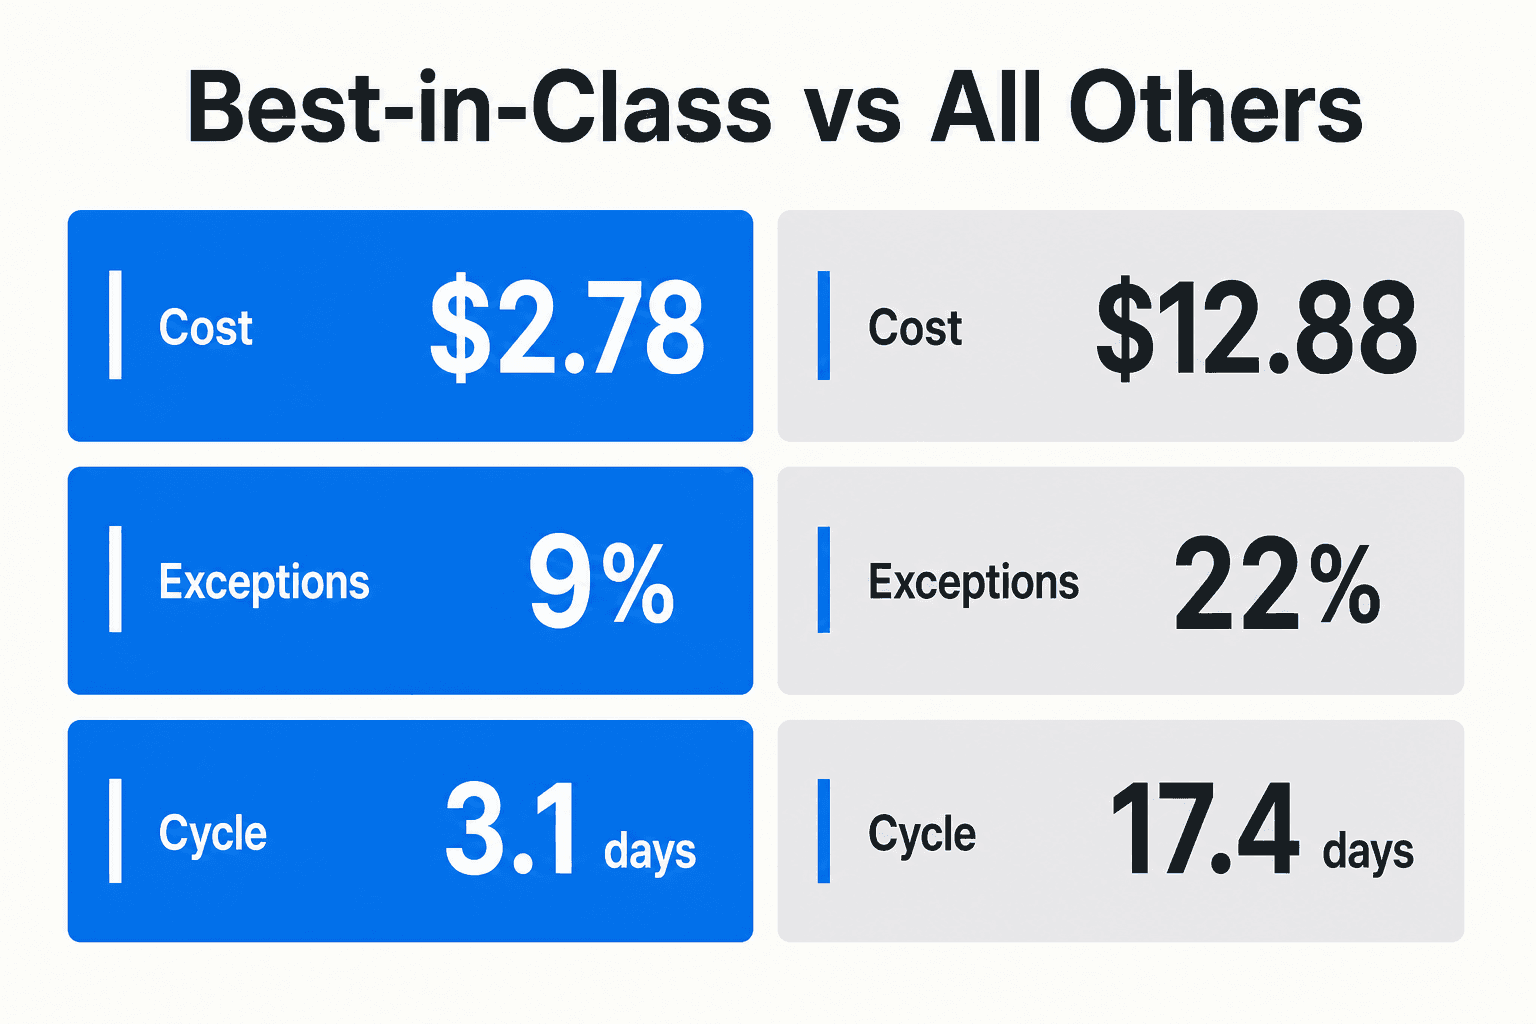
Best-in-class AP teams process an invoice for $2.78. Everyone else pays $12.88. Exception rates sit at 9% vs 22%. Cycle time: 3.1 days vs 17.4.
Those three pairs come from Ardent Partners’ State of ePayables 2024 (sample mostly North America, with EMEA and APAC).
For UK/EU owner-operators and lean US owner-operator teams, the invoice often isn’t in AP yet. It’s stuck in Amazon, Apple, Meta, or a SaaS billing portal, or sitting as a PDF in email. The benchmarks below still matter; they assume invoices are already captured.
Key figures at a glance
| Metric | Best-in-Class (2024) | All Others (2024) | Source |
|---|---|---|---|
| Cost per invoice | $2.78 | $12.88 | Ardent State of ePayables 2024 |
| Exception rate | 9.0% | 22.0% | Same |
| Cycle time (days) | 3.1 | 17.4 | Same |
Geography (2024 sample): n=212 AP/finance leaders; 59% North America, 30% EMEA, 11% APAC.
2025 update (same Ardent program; n=204; 58% NA / 31% EMEA / 11% APAC): averages $9.84 / 18.4% / 8.2 days; Best-in-Class $2.65 / 11.1% / 2.9 days; All Others $12.42 / 20.9% / 13.5 days. Full year tables live in the Cost, Exceptions, and Cycle sections below.
Optional cross-check: APQC Open Standards Benchmarking (cross-industry) reports a median total AP cost of $6.00 per invoice (n≈4,821). Different methodology than Ardent’s all-inclusive survey averages. See Methodology.
All Others means the bottom ~80% of Ardent’s sample by cost + cycle performance, not a fully manual cohort. Best-in-Class is the top 20% on those two metrics.
Cost per invoice statistics: best-in-class vs the rest
$2.78 vs $12.88. That’s the 2024 Ardent gap: the pair most cost-per-invoice statistics pages lead with. Best-in-Class costs are roughly 78–80% lower than peers. In the 2025 study the endpoints move slightly: $2.65 vs $12.42 (~79% lower), with a market average of $9.84 (was $9.40 in 2024).
What the numbers mean
- Average ($9.40 / $9.84): all-inclusive cost to process one invoice across Ardent’s surveyed AP/finance leaders (global sample, majority North America).
- Best-in-Class ($2.78 / $2.65): top 20% with the lowest average processing costs and shortest cycle times.
- All Others ($12.88 / $12.42): everyone else in the sample. Ardent does not define All Others as fully manual.
Survey sample
- State of ePayables 2024 / AP Metrics that Matter 2025: n=212; survey Mar–May 2024; 59% North America, 30% EMEA, 11% APAC.
- State of ePayables 2025: n=204; survey Mar–May 2025; 58% NA, 31% EMEA, 11% APAC.
APQC median
APQC’s Open Standards Benchmarking measure for total cost to process AP per invoice shows a public median of $6.00 (sample size ≈4,821 companies; cross-industry). Definition includes outsourced + overhead + personnel + system + other costs, divided by invoices processed. Quartiles aren’t on the public measure page.
What cost surveys often miss
Benchmarks start when the invoice is already in the AP queue. They rarely price the login + download labor from vendor portals (Amazon Business, Apple, Meta ads, AWS, Stripe, Adobe, and friends). For owner-operators, that chase is real time. It just doesn’t show up as a line item in Ardent or APQC tables.
Invoice exception rates
Ardent’s exception rate counts invoices that hit coding issues, missing info, approval bottlenecks, lack of PO data, and similar process stops. That is not the same as the share of invoices with a data-entry typo.
Ardent figures
| Year | Average | Best-in-Class | All Others | Sample geo |
|---|---|---|---|---|
| 2024 | 14.0% | 9.0% | 22.0% | 59% NA / 30% EMEA / 11% APAC |
| 2025 | 18.4% | 11.1% | 20.9% | 58% NA / 31% EMEA / 11% APAC |
9% vs 22% (2024) is the Best-in-Class vs All Others exception pair. Best-in-Class still run exceptions: just fewer of them, and they clear them faster.
Vendor customer benchmark
Medius publishes customer First Time Right figures: average 97.5% FTR (2.5% error) and best performers 99.1% FTR (0.9% error). Medius often treats ≤5% as “acceptable” and <1% as leading. This is Medius customer data, not a third-party industry sample.
Processing time and cycle time
3.1 days vs 17.4 days. That’s Ardent 2024 Best-in-Class vs All Others for invoice cycle time (receipt through process readiness as Ardent frames it; sample majority North America). Average sits around 9.2 days (reported as 9.15 in the full 2024 table).
Ardent cycle times
| Year | Average | Best-in-Class | All Others |
|---|---|---|---|
| 2024 | ~9.2 days | 3.1 days | 17.4 days |
| 2025 | 8.2 days | 2.9 days | 13.5 days |
2025 Best-in-Class are described as roughly 79% faster than peers on cycle time: same shape as the cost gap.
Long cycles burn early-pay discounts and vendor goodwill. The Ardent pairs are enough to make that case.
Late payments
Cost and cycle benchmarks tell you what happens after the invoice is in the system. Late payment is often a symptom of missing docs, coding holds, approval queues, and, for small teams, portal chase.
If invoices arrive late to the books because someone had to log into Amazon or dig through email, your “AP cycle time” clock started late. The Ardent day-counts never saw that delay.
Automation adoption
Fully automated AP is still the exception outside large enterprises.
One Ardent signal: straight-through processing averages 32.6% in ePayables 2024 and 35.4% in 2025 (same NA/EMEA/APAC mixes as above). Not the same as “% of teams fully automated.”
For small teams, “automation” that only watches the inbox still leaves portal invoices on the table.
Where invoices actually arrive in 2026 (email + portals)
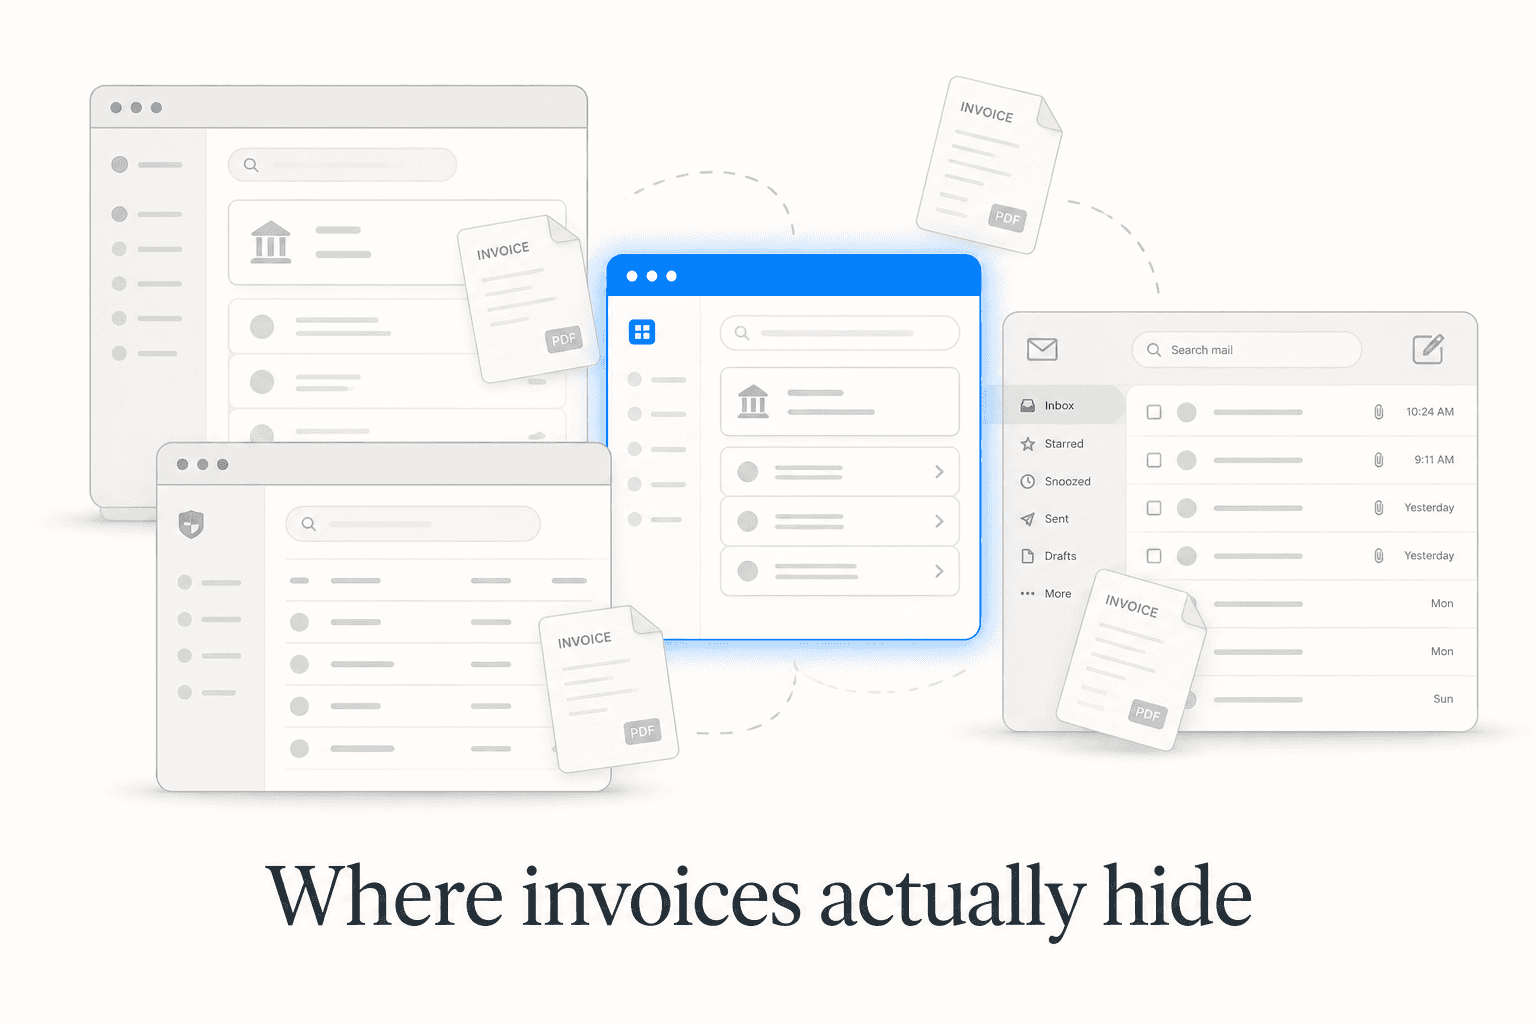
Most B2B invoices arrive digitally. That does not mean they’re digitally processed. Email PDFs still get typed into accounting tools. And a growing share of spend never hits email at all, it lives behind a login.
There’s also a capture gap before the AP clock starts.
Portal-dependent vendors
Common “must log in” sources for owner-operators (UK/EU and US alike):
- Amazon / Amazon Business
- Apple (App Store, Apple Business, device invoices, and the eternal invoice-vs-receipt mess)
- Meta ads billing
- AWS, Google Cloud
- Stripe, Adobe, and other SaaS billing portals
How-tos if you’re hunting PDFs by hand: download Amazon invoices, download Apple invoices, and find & view Apple receipts.
Digital delivery ≠ digital processing
An invoice in Gmail is not an invoice in Xero or QuickBooks. Someone still has to download, rename, code, and file it, or wire that path. Tools that only watch email miss the portal half of the problem.
We collect from inbox and portals, then export to Xero, QuickBooks, DATEV, or Google Drive. The qualitative pattern is enough: if your stack assumes every invoice arrives as email, your capture layer is incomplete.
More on capture/extraction: extract invoices and receipts.
Matching, coding, and capture quality
Three-way matching and GL coding fail for boring reasons: missing PO, quantity/price drift, duplicates, bad supplier master data. Fraud and BEC controls (AFP Payments Fraud Survey and peers) sit in the same conversation when payment details change.
Upstream rule is simple:
Bad capture, then bad OCR, then bad coding, then failed match.
If the PDF was the wrong document, a truncated portal download, or a receipt mistaken for a tax invoice, no matching engine saves you. Exception rates in Ardent’s tables partly reflect that mess: coding errors, missing info, lack of PO data.
Use the exception rates above. Capture quality is the lever you control before matching starts.
AI extraction & touchless processing
“AI invoice processing” covers everything from a thin OCR wrapper to learned coding and true touchless AP.
- Extraction accuracy and touchless % vary wildly by vendor sample and document mix. Prefer named studies (Deloitte/Basware-class, Ardent Best-in-Class commentary) over anonymous “industry <0.1% error” claims.
- Ardent’s straight-through averages (32.6% in 2024; 35.4% in 2025) are one public anchor for how often invoices clear without manual intervention in their sample, not a universal OCR accuracy score.
- Medius FTR figures (above) are customer benchmarks, not global AP truth.
OCR that fills fields is not the same as an AP process that codes, matches, and pays without a human.
Key takeaways
| If… | Then… | Cite |
|---|---|---|
| Your cost/invoice sits near Ardent All Others (~$12–$13) | You’re far from Best-in-Class (~$2.65–$2.78); ~78–80% gap is real in their sample | Ardent 2024 / 2025 |
| Your exception rate is in the ~20%+ peer band | Rework and approval drag dominate; BiC runs closer to ~9–11% | Ardent exception tables |
| Cycle time looks like All Others (~13–17 days) | Early-pay discounts and vendor trust are at risk vs BiC ~3 days | Ardent cycle tables |
| A large share of invoices live behind portals | Email-only automation is incomplete: collection is the missing step | Qualitative / product reality |
Methodology
- We cite Ardent Partners, APQC, and clearly labeled vendor customer data (for example Medius FTR).
- Year + geography labeled. Ardent 2024: n=212, 59% NA / 30% EMEA / 11% APAC. Ardent 2025: n=204, 58% NA / 31% EMEA / 11% APAC. APQC median is cross-industry OSB (n≈4,821).
- Definitions
- Cost per invoice: Ardent all-inclusive processing cost; APQC total process cost (personnel/systems/overhead/outsourced/other) per invoice.
- Exception: Ardent: invoices hitting coding, missing info, approval, PO-data, and related stops: not identical to “≥1 data-entry error.”
- Cycle time: Ardent: time to process a single invoice (receipt through process readiness as framed in their reports).
- Best-in-Class: Ardent top 20% on lowest cost and shortest cycle time.
- All Others: remaining ~80% of Ardent’s sample: not “fully manual only.”
- Touchless / straight-through: invoices processed without manual intervention (Ardent STP % as reported).
- Corrections welcome if we missed a primary source. We update this page in place.
- Last verified September 2026.
Sources:
- Ardent AP Metrics that Matter 2025 (Feb 2025; underlying State of ePayables 2024)
- State of ePayables 2024 (Medius)
- State of ePayables 2025 (Bottomline)
- Payables Place Part Nine (Ardent excerpt)
- APQC cost measure
- Medius FTR / accuracy (vendor customer data)
If your bottleneck is getting invoices into the system
The benchmarks above assume the invoice is already in AP. For owner-operators, the missing step is often collecting from Gmail/Outlook plus Amazon, Apple, Meta, and SaaS portals, then exporting to Xero, QuickBooks, DATEV, or Drive.
If you’re comparing email-only tools, see our Wellybox alternative. To automate collection: download invoices automatically.
If you’re still logging into Amazon for PDFs, that’s the work that doesn’t show up in cost-per-invoice surveys.