Articles
Profit and Loss Account Example with Balance Sheet Guide
Your bank balance says one thing. Your sales dashboard says another. Then your accountant sends a profit and loss report and a balance sheet, and suddenly it feels like everyone is talking about a different business.
That’s normal.
Most new business owners can see money coming in and bills going out, but they still can’t answer a simple question with confidence: Is the business healthy? The answer usually sits in two reports that are often explained separately and rarely connected clearly.
This guide gives you a practical profit and loss account example with balance sheet thinking from the ground up. We’ll start where the numbers really begin, with invoices, receipts, portal downloads, and expense records. Then we’ll turn those raw documents into a P&L. After that, you’ll see how the final profit figure moves into the balance sheet through retained earnings.
Your Business Financial Story in Two Chapters
You might be in this situation right now. You’ve sent invoices, paid suppliers, covered software bills, and watched cash move through Stripe, PayPal, Amazon, or your bank account. Yet when someone asks whether the business made money this month, the answer is less obvious than it should be.

That confusion gets worse in invoice-heavy businesses. 68% of small business accountants report that separating portal fees or handling multi-currency receipts from platforms like Amazon and Stripe is a major reconciliation challenge, according to profit and loss examples for ecommerce businesses. If your numbers start messy, your reports will feel messy too.
The scorecard and the snapshot
A profit and loss account is your scorecard. It measures performance over a period, such as a month, quarter, or year. It answers questions like:
- Did sales cover costs
- Were expenses controlled
- Did the business end the period with a profit or a loss
A balance sheet is your snapshot. It shows where the business stands on one specific date. It answers different questions:
- What does the business own
- What does it owe
- How much value belongs to the owner or shareholders
Those two reports tell one story from different angles. One shows movement over time. The other shows position at a moment.
If the P&L says how the game went, the balance sheet shows the scoreboard, the players still on the field, and what equipment belongs to the team at the final whistle.
Why the connection matters
A lot of business owners read these reports as if they live in separate folders. They don’t. The end result of the P&L affects the equity section of the balance sheet. That’s the link people often miss.
If you want a practical business owner view of this kind of reporting, IGNIITE Business Solutions shares useful financial reporting insights that complement the accountant’s perspective well.
Once you see the flow from source document to P&L to balance sheet, the reports stop feeling abstract. They become readable.
The Profit and Loss Account Your Business Scorecard
Monday morning often starts with a pile of paperwork. A few customer invoices went out last week. Supplier bills landed in your inbox. There are card receipts for fuel, software, and courier costs. The profit and loss account is the report that turns that pile into a scorecard for the period and answers one plain question: did the business make money after covering the costs of earning it?
The P&L covers a period of time, such as a month, quarter, or year. It collects the income you earned during that period, matches it with the related costs, and shows the result at the bottom. If the balance sheet is a snapshot, the P&L is the score of the match.
Revenue starts with the sales records
The top line is revenue. In practice, that figure usually begins with sales invoices, till records, or payment platform reports. If you run an invoice-heavy business, this matters a lot. One invoice sent to a customer increases your sales for the period, even if the cash arrives later.
So the first job of the P&L is simple. Add up the income from normal trading activity for the reporting period.
Next, subtract the direct costs to get gross profit
After revenue, the P&L subtracts the costs directly tied to what you sold. For a product business, that may include materials, production wages, and manufacturing overhead. For a service business, it may include subcontractors or staff time spent delivering client work.
That gives you gross profit.
Gross profit shows whether the core offer is paying its way before office costs and finance costs enter the picture. If sales are rising but gross profit stays thin, the business may be working harder without keeping much of the reward.
A healthy top line can still hide a weak business if direct costs are eating through each sale.
Operating expenses show the cost of keeping the business running
Next come the running costs that support the business as a whole. These often include rent, admin wages, software subscriptions, insurance, marketing, delivery overhead, professional fees, and bad debts.
These expenses usually come from purchase invoices, payroll records, bank transactions, and expense receipts. Once posted to the right categories, they move from raw documents into the P&L as operating expenses.
Subtract those costs from gross profit, and you reach operating profit. This is one of the clearest measures of day-to-day performance because it shows what the business earned from normal operations before interest and tax.
For another plain-English explanation of common line items, Understanding Profit and Loss Statements is a useful companion.
Net profit is the final result for the period
After operating profit, the P&L includes items such as loan interest and tax, where relevant. What remains is net profit, or a net loss if costs were higher than income.
That bottom line matters because it is more than a number on a report. It is the part of the period’s trading result that will later feed into equity on the balance sheet through retained earnings.
Here is the flow in its simplest form:
- Revenue
- Less direct costs
- Equals gross profit
- Less operating expenses
- Equals operating profit
- Less interest and tax
- Equals net profit
The Balance Sheet A Financial Snapshot in Time
Unlike the P&L, the balance sheet shows your business's financial position on one specific date. If the P&L is the scorecard for a period, the balance sheet is the report you could print at close of business today to see what the company owns, what it owes, and what is left for the owner.
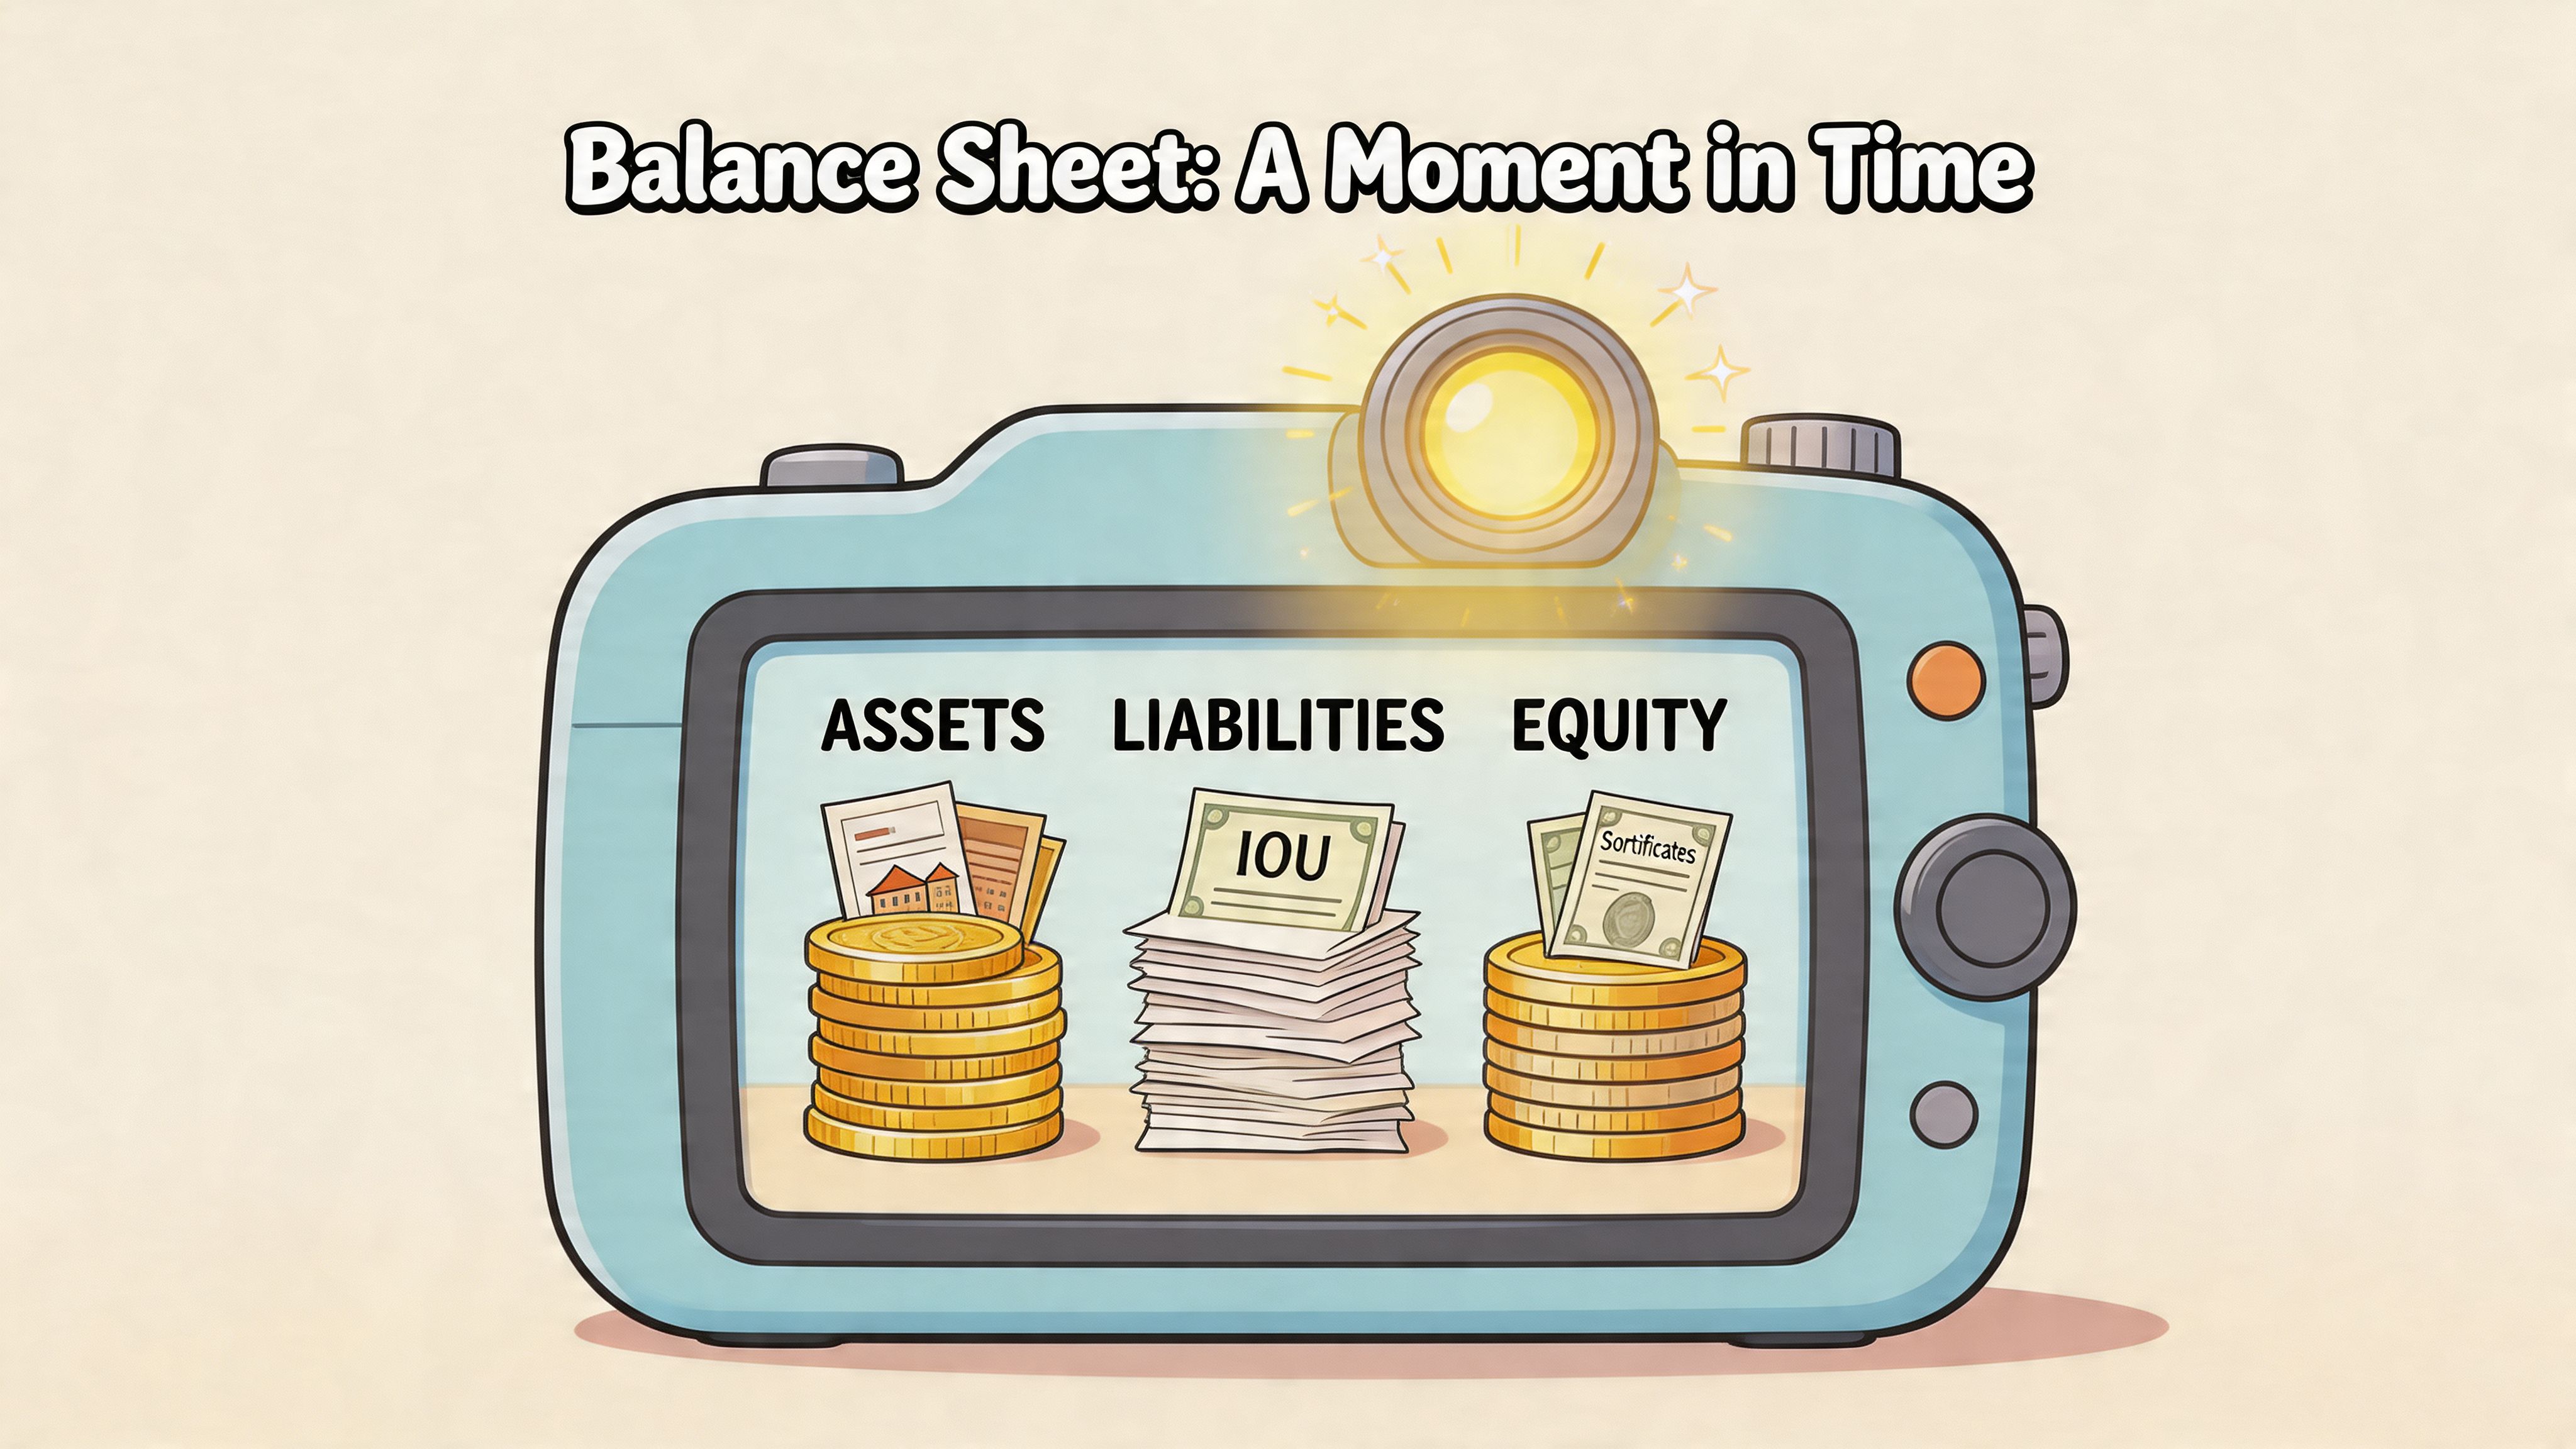
Every balance sheet is built on one equation:
Assets = Liabilities + Equity
That equation matters because every transaction from your daily paperwork has to end up on one side or both sides of it. An unpaid sales invoice can increase accounts receivable. A supplier bill can increase expenses in the P&L and accounts payable on the balance sheet. A loan can increase cash and liabilities at the same time.
Assets are what the business controls
Assets are resources the business can use. Common examples include cash, accounts receivable, equipment, and inventory.
For an invoice-heavy business, accounts receivable often becomes one of the biggest numbers on the page. You may have made the sale already and recorded the income, but the cash has not arrived yet. The balance sheet shows that gap clearly.
A laptop bought for the business can appear as an asset too. So can stock sitting on the shelf waiting to be sold.
Liabilities are what the business owes
Liabilities are amounts the business must pay. Supplier bills, tax owed, loans, credit card balances, and unpaid payroll all belong here.
This section often answers a question new owners ask after a profitable month: "Why is cash still tight?" Profit does not cancel debts. You can earn well on paper and still have large bills due to suppliers, lenders, or the tax authority.
A good month on the P&L doesn't automatically mean the balance sheet is strong.
Equity is the owner's stake
Equity is the owner's claim after liabilities are deducted from assets. It usually includes money the owner put in, plus profits kept in the business, minus any drawings or dividends taken out.
The retained earnings line connects the P&L to the balance sheet. Each period's profit increases retained earnings if it stays in the business. Each loss reduces it.
A simple way to read the three parts is:
- Assets are the resources
- Liabilities are outside claims
- Equity is the owner's remaining claim
A short visual explanation helps if you prefer seeing the structure before reading reports in detail:

Why the balance sheet must balance
The numbers must always balance because each transaction is recorded in a way that keeps the equation intact.
Suppose cash increases. That increase needs an explanation. It may come from a customer payment, a new loan, an owner investment, or profit that has been earned and retained in the business. The balance sheet makes you identify the source instead of looking at cash in isolation.
That discipline is what makes the report so useful to a business owner. It shows whether growth is being funded by collected cash, unpaid invoices, borrowed money, or accumulated profit. It also exposes issues a P&L cannot show on its own, such as rising debt, overdue payables, or owner withdrawals reducing equity.
How Your P&L Feeds Your Balance Sheet
This is the step many people never see clearly enough.
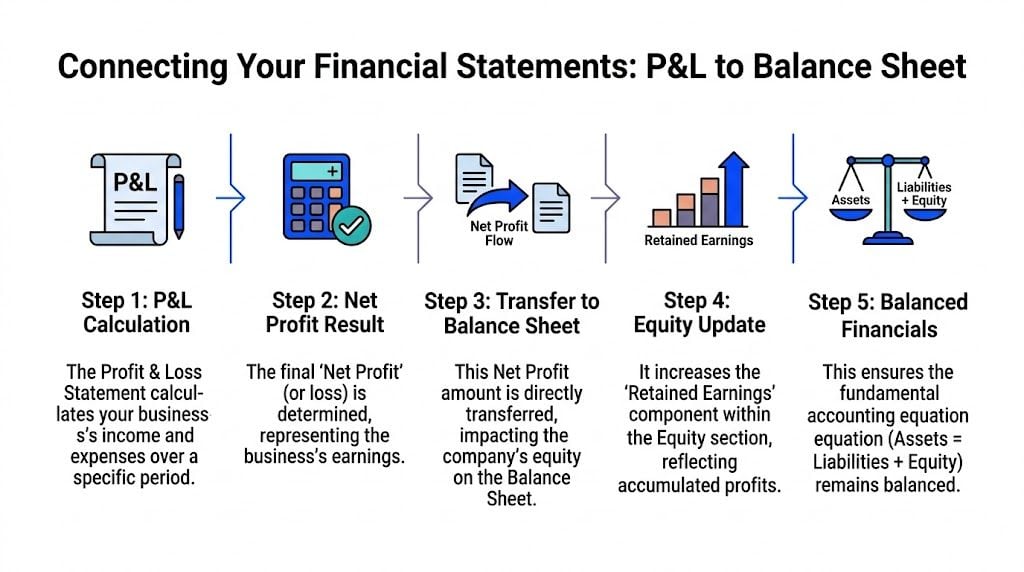
Your P&L calculates profit over a period. Your balance sheet shows equity at a point in time. The bridge between them is retained earnings. When the business earns a profit and keeps it in the business, that profit increases retained earnings.
The mechanical link
Think of the process in plain terms:
- You record invoices, receipts, and bills.
- Those entries build your revenue and expense totals.
- The P&L calculates net profit or net loss.
- That result moves into equity on the balance sheet.
- The balance sheet still balances because the result also shows up through assets, liabilities, or both.
If the business makes a profit and the cash is still in the business, assets may increase, usually as cash or receivables. At the same time, equity increases through retained earnings.
If the business makes a loss, retained earnings move the other way.
A very small example
Suppose your business starts the month with:
- Cash of $1,000
- No liabilities
- Equity of $1,000
During the month, you earn $300 in revenue and incur $200 in expenses. Your P&L shows $100 net profit.
What happens next?
Your ending balance sheet might look like this:
- Cash becomes $1,100
- Liabilities remain $0
- Equity becomes $1,100
The extra $100 didn’t appear by magic. It came from the P&L result and was added to equity through retained earnings.
Key link: Profit belongs to the period on the P&L first, then becomes part of accumulated equity on the balance sheet.
Why this trips people up in real businesses
The logic above is simple. Real bookkeeping makes it messier because cash timing and invoice timing aren’t always the same.
That’s why this issue keeps surfacing in finance teams. A 2026 PwC report found that 40% of finance teams struggle with automation handoffs, often because they don’t clearly track how net profit updates balance sheet equity, especially when accruals from invoices fetched from platforms like Stripe or PayPal are involved, as noted in this discussion of P&L and balance sheet connection challenges.
Where invoice-heavy businesses feel it most
If your business collects sales through portals and receives dozens or hundreds of supporting documents, the trail can break in a few places:
- Invoices are fetched but not posted correctly
- Fees are netted off and hidden inside payouts
- Receipts are missing, so expenses are understated
- Accrual entries sit on the balance sheet while owners only look at cash
That’s why a solid profit and loss account example with balance sheet has to start before the reports. It has to start with the documents and the bookkeeping entries that feed them.
A Practical P&L and Balance Sheet Example
A worked example makes the link easier to see.
Suppose you run a small wholesale business. During the month, you send invoices to customers, receive supplier bills, pay overhead costs, and end up with a stack of ordinary documents. Those invoices and receipts are the raw ingredients. Your bookkeeping turns them into entries, those entries build the P&L, and the final profit then updates equity on the balance sheet through retained earnings.
Start with a fresh set of numbers so the flow stands on its own.
From source documents to the P&L
Assume the month’s records show:
- Sales invoices issued to customers: £120,000
- Supplier invoices for goods sold: £72,000
- Overheads from rent, software, wages, and utilities: £30,000
- Loan interest charged by the bank: £3,000
Once those documents are posted, the P&L scorecard looks like this:
Item
Amount
Revenue
£120,000
Cost of sales
(£72,000)
Gross profit
£48,000
Operating expenses
(£30,000)
Operating profit
£18,000
Interest
(£3,000)
Net profit
£15,000
That £15,000 is the profit for the period. It answers one question only: how much the business earned after costs.
Then watch the balance sheet update
Now assume the business started the month with:
- Cash: £20,000
- Trade receivables: £10,000
- Inventory: £15,000
- Equipment: £40,000
Total assets at the start: £85,000
And on the funding side:
- Trade payables: £12,000
- Bank loan: £18,000
- Share capital: £40,000
- Retained earnings: £15,000
Total liabilities and equity at the start: £85,000
After the month’s trading, the balance sheet changes for two reasons. First, daily transactions change assets and liabilities. Second, the period’s £15,000 net profit is added to retained earnings, assuming no dividend is paid out.
That gives you this simplified picture:
Balance Sheet (Start)
Balance Sheet (End)
Cash
£20,000
£26,000
Trade receivables
£10,000
Inventory
£15,000
£11,000
Equipment
£40,000
Total assets
£85,000
£95,000
Trade payables
£12,000
£14,000
Bank loan
Share capital
Retained earnings
£23,000
Current period profit
Less drawings or dividend
(£15,000 consolidated into retained earnings if closed)
To keep the closing position tidy, accountants usually roll the current period profit into retained earnings at period end. So if opening retained earnings were £15,000, and the business earned £15,000 with nothing paid out, closing retained earnings become £30,000.
That is the mechanical link many business owners miss.
Why the numbers changed
The P&L does not sit separately from the balance sheet. It feeds it.
Revenue came from customer invoices. Some customers paid, which increased cash. Some still owed money, which increased receivables. Cost of sales reduced inventory or created supplier balances. Overheads and interest reduced profit. Once all income and expenses were totaled, the remaining £15,000 increased retained earnings.
A useful way to picture it is this:
- The P&L works like a scorecard for the period
- The balance sheet works like a snapshot at the end of the period
- Retained earnings are the bridge between them
The journal flow in plain English
You do not need to memorise formal journal entries to follow the logic.
- Customer invoices record revenue, and often receivables.
- Supplier bills and expense receipts record costs, plus payables or cash payments.
- Those income and expense entries build the P&L during the month.
- At period end, net profit is transferred into retained earnings within equity.
The key takeaway for business owners is simple. Profit becomes part of the balance sheet story.
That is why two firms with similar sales can end the month in very different positions. One may show strong receivables, cash, and growing retained earnings. Another may show thin profit, rising debts, or owner withdrawals that prevent equity from building up.
Ensuring Reliable Data with Invoice Automation
The reports are only as good as the records feeding them.
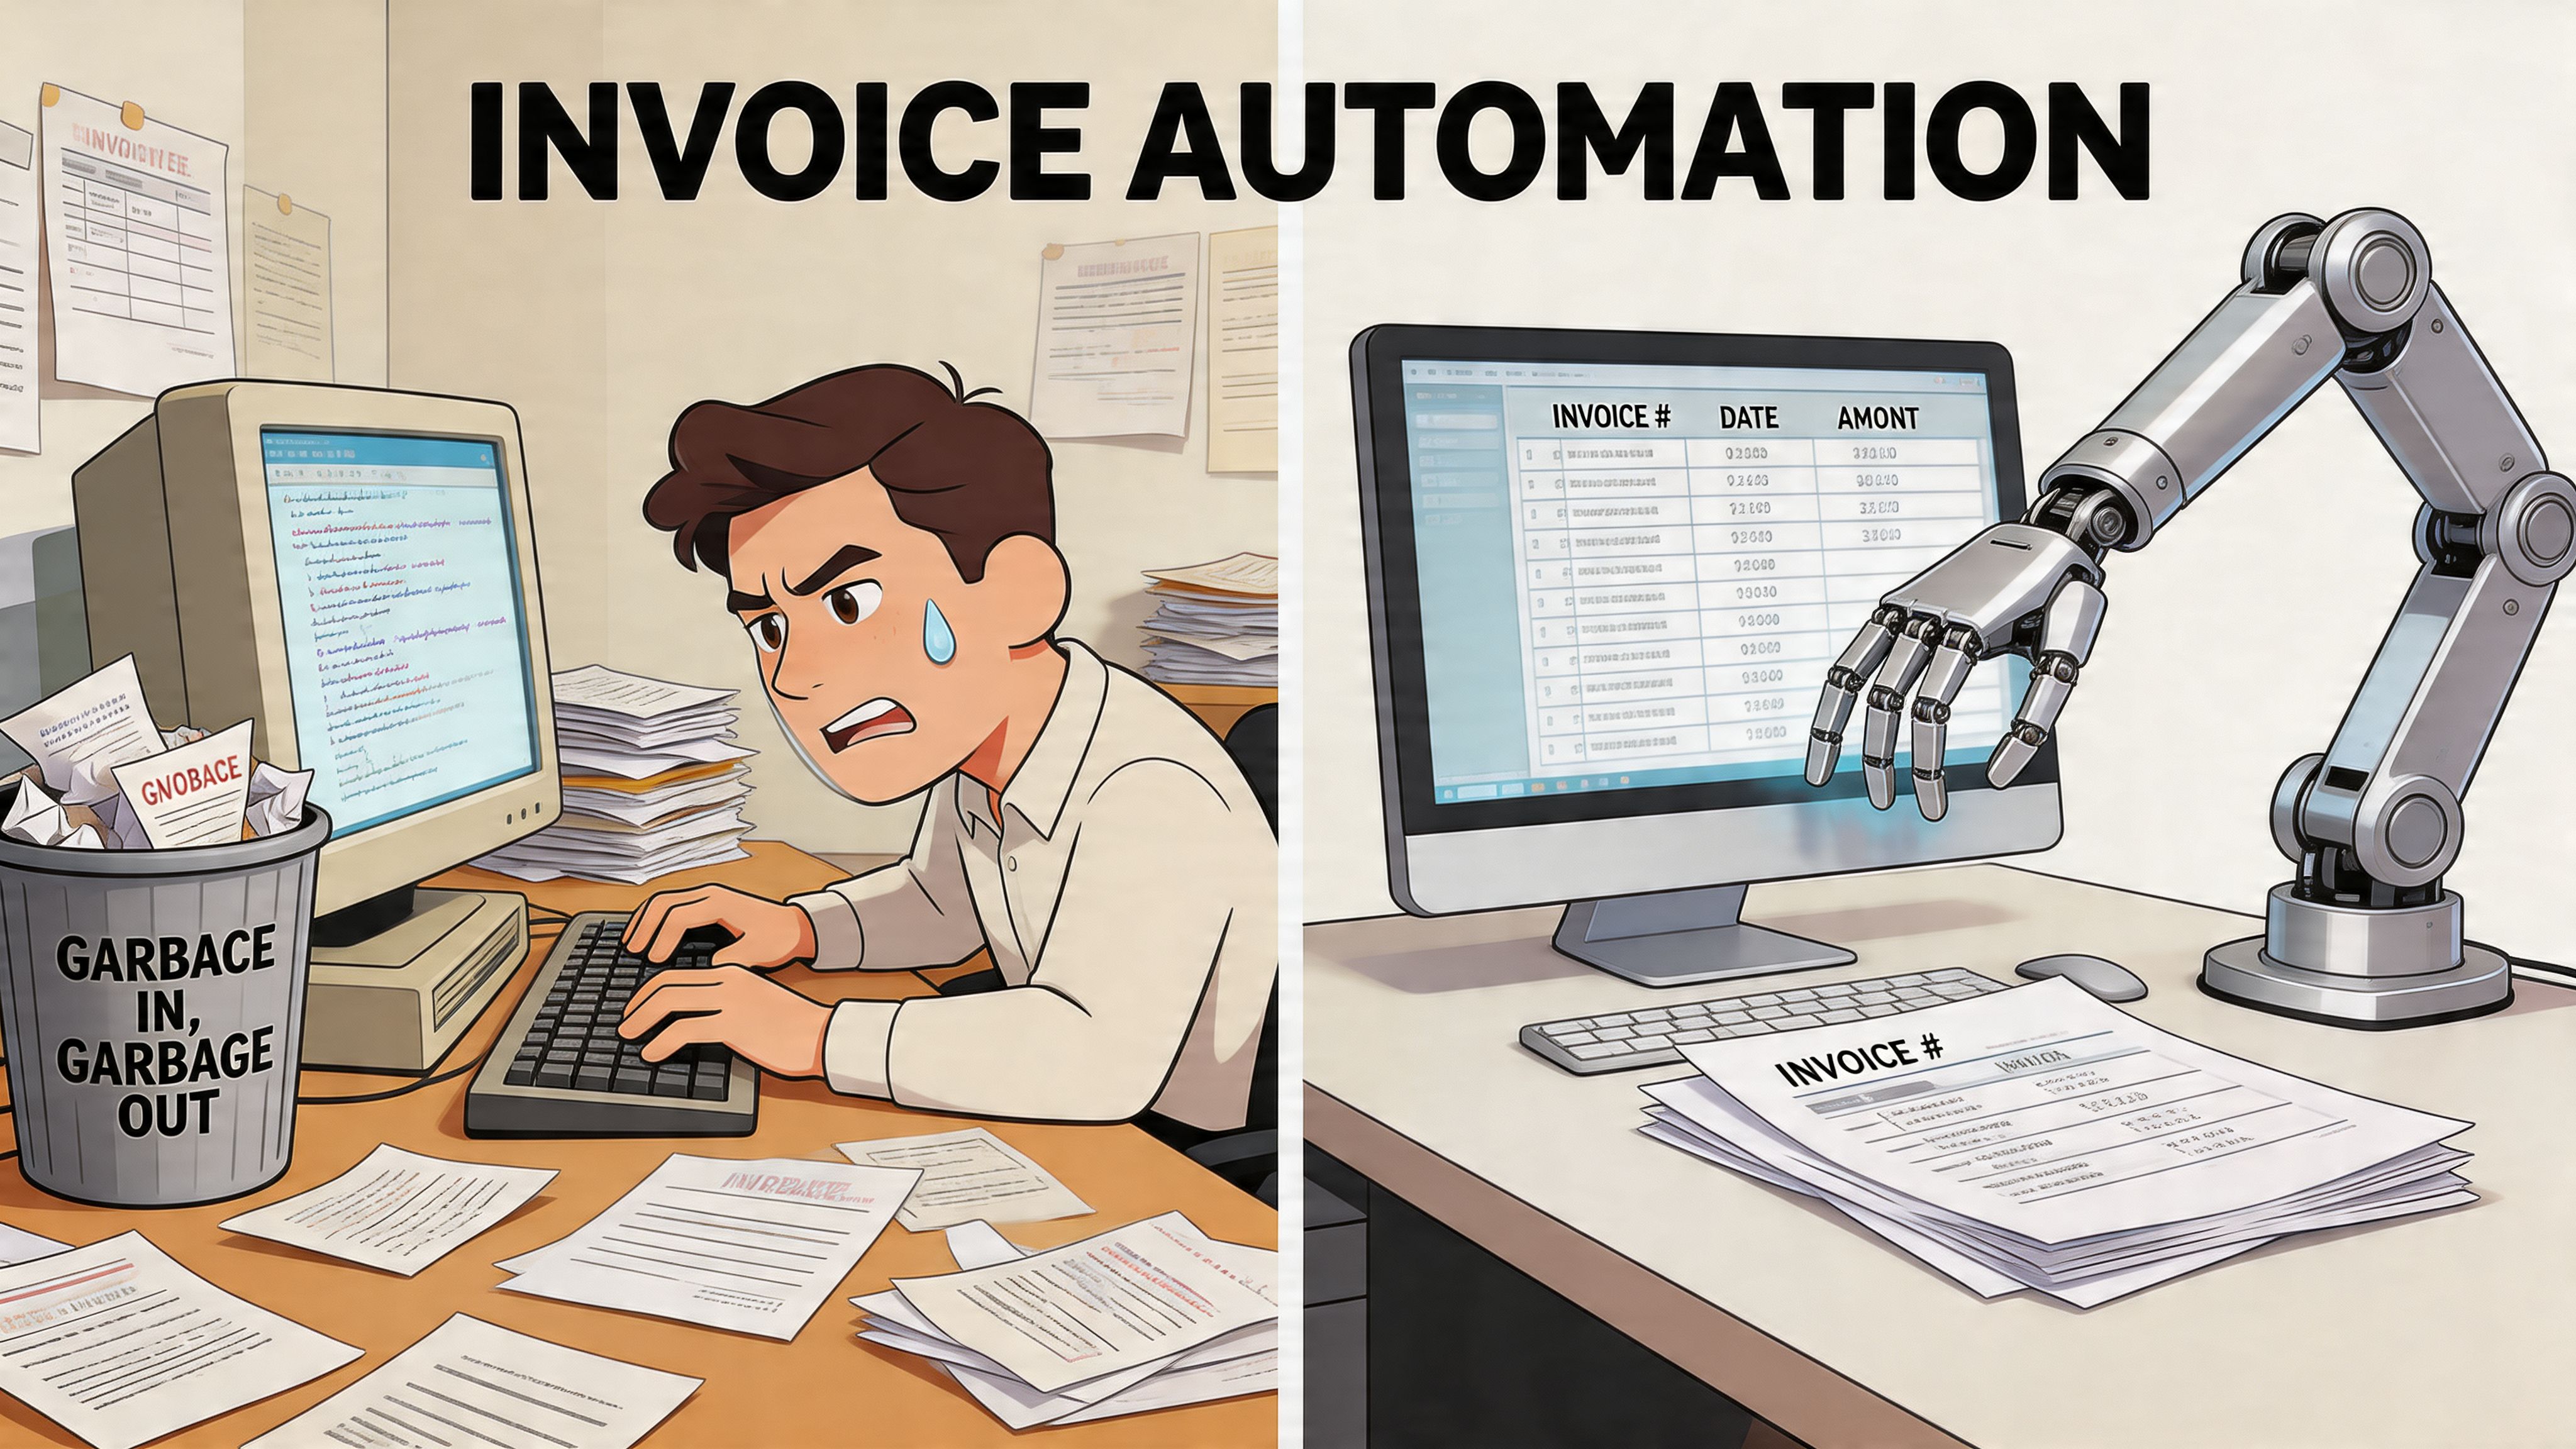
If a bookkeeper manually downloads invoices from Amazon, Stripe, Google, Microsoft, PayPal, supplier portals, and email attachments, errors creep in fast. A fee gets missed. A duplicate invoice gets posted. A receipt lands in the wrong month. Then the P&L is off, and the balance sheet is off with it.
Where manual work usually breaks
Invoice-heavy businesses often run into the same practical problems:
- Portal fees get mixed into revenue instead of being recorded separately as expenses
- Receipts arrive in different formats across email inboxes and web portals
- Missing documents delay reconciliations and force guesswork at month end
- Unpaid invoices stay unclear so owners confuse profit with collected cash
A system that collects documents consistently gives the accounting software cleaner inputs. That matters because the P&L and balance sheet are not independent outputs. They rely on the same underlying entries.
What automation changes
Automation helps at the document stage first. Instead of waiting for someone to log in to ten portals and drag PDFs into folders, the process can fetch invoices and receipts, extract key details, and send organized data into the accounting workflow.
For teams dealing with this volume, tools such as Booksmate connect to online portals and email inboxes to automatically fetch invoices and receipts, process them with AI-powered data extraction, organize them in a central dashboard, and prepare them for export to accounting software.
That doesn’t replace accounting judgment. It reduces the number of avoidable data-capture mistakes before judgment is even applied.
Clean source documents create cleaner ledgers. Cleaner ledgers create financial reports you can trust.
When the invoice trail is reliable, it becomes much easier to see why gross profit moved, why liabilities changed, and why retained earnings increased or decreased.
Frequently Asked Questions About Your Financials
Some questions come up again and again, especially after someone sees a profit and still feels uneasy about cash.
Why doesn’t my net profit match my bank balance
Because profit and cash are not the same measurement.
Your P&L includes income earned and expenses incurred during the period. Your bank balance only shows cash that has moved. If you issued invoices that customers haven’t paid yet, the P&L may show revenue while the bank account does not. If you bought equipment or repaid a loan, the cash may have moved without affecting profit in the same way.
What’s the difference between cash and accrual accounting
Cash accounting records income when money is received and expenses when money is paid. Accrual accounting records income when it is earned and expenses when they relate to that income.
That timing difference matters a lot. 70% of US small businesses operate on a cash basis, and in those cases the P&L can overstate health without proper balance sheet reconciliation, while accrual accounting gives a more accurate picture by matching revenues and expenses, according to this US GAAP P&L statement example.
Here’s the plain version:
- Cash basis is easier to follow from the bank account
- Accrual basis is better for seeing true period performance
If you use a lot of invoices, subscriptions, deferred bills, or customer balances, accrual accounting usually gives the clearer picture.
How often should I review my P&L and balance sheet
Most owners should review both regularly, not only at tax time.
A practical rhythm is:
- Monthly for most small businesses
- More often if cash is tight, sales move quickly, or invoice volume is high
- Before major decisions like hiring, borrowing, or changing pricing
Substantial value comes from reading both together. A P&L on its own can flatter a business. A balance sheet on its own can feel static. Together, they show performance and position.
Review the P&L to see how the month went. Review the balance sheet to see what that month left behind.
If your team spends too much time chasing invoices before you can even trust your numbers, Booksmate can help simplify the document collection side of the process. It connects to portals and inboxes, gathers invoices and receipts, extracts the data, and gets records ready for export so your P&L and balance sheet start from cleaner inputs.