

You already know the feeling. Sales are coming in, supplier costs keep moving, and someone asks a simple question that isn’t simple at all: “What margin are we making by product, by job, or by invoice?”
That’s where most Excel files start to go wrong. The sheet looks tidy for a week, then discounts get added, shipping gets buried in another tab, refunds appear later, and half the team starts using markup when they mean margin. A reliable margin calculator in Excel fixes that, but only if you build it for real accounting data instead of classroom examples.
Table of Contents
Why Your Business Needs a Reliable Margin Calculator
Why this matters in day-to-day decisions
Excel works well if you treat it like a control tool
Building Your Basic Margin Calculator in Excel
Set up the worksheet so it stays usable
Use formulas that audit cleanly
What works and what doesn’t
Distinguishing Margin from Markup
They answer different questions
What goes wrong in practice
Customizing Your Calculator for Advanced Scenarios
Work backward from a target margin
Add controls for messy data
Build advanced logic in separate columns
Use Goal Seek carefully
Automating Calculations with Invoice Data
Build around imported tables, not manual typing
Clean the data before you calculate margin
FAQ for Your Excel Margin Calculator
How should I handle shipping, fees, and rebates
Why am I getting errors or strange percentages
Can I use the same setup in Google Sheets
Why Your Business Needs a Reliable Margin Calculator
A lot of businesses price from habit. They look at last month’s selling price, add a bit, and hope the result still works. That breaks fast when purchase costs move, sales staff discount on the fly, or service teams forget to include all direct costs.
The bigger problem is that many spreadsheets answer the wrong question. A proper margin calculator doesn’t just show profit dollars. It shows how much of each sale remains after direct cost, which is what pricing, product decisions, and management reporting depend on.
The core rule is simple. Profit margin is profit divided by selling price, not cost. In Excel terms, the standard formula is =(price-cost)/price, and ExcelJet shows a worked example where price is 5 and cost is 4, producing 1/5 = 0.20, or 20% when formatted as a percentage in Excel’s number format (ExcelJet’s margin formula example).
Why this matters in day-to-day decisions
If your sheet uses the wrong denominator, every pricing discussion starts from bad data. A product can look healthier than it is. A service line can seem to be hitting target when it isn’t. That usually leads to one of three mistakes:
Prices stay too low: teams think they’ve protected profit, but they’ve only protected markup.
Reports become misleading: product comparisons stop being apples to apples.
Managers lose trust in the file: once people spot one broken formula, they question the whole workbook.
Practical rule: If the percentage is meant to describe profit as part of the sale, divide by revenue. If it’s meant to describe how much was added onto cost, divide by cost.
Excel works well if you treat it like a control tool
A margin calculator in Excel is useful because it sits close to the people doing the work. Sales, bookkeeping, and management can all inspect the same lines. You can trace a result back to source data. You can test pricing before changing a quote.
That’s also why it pays to think beyond formulas and into process. If your team still spends hours gathering invoices and receipts before they can even calculate anything, the spreadsheet won’t solve the whole problem. Better upstream data handling matters just as much, especially if you’re already looking at accounting automation software for finance workflows.
Building Your Basic Margin Calculator in Excel
A basic model doesn’t need to be fancy. It needs to be clear, reusable, and easy to audit. If a junior bookkeeper can open it, follow the columns, and trace every result, you’re on the right track.
Start with a clean tab. Don’t bury formulas inside merged cells, side notes, and hard-coded overrides.
Set up the worksheet so it stays usable
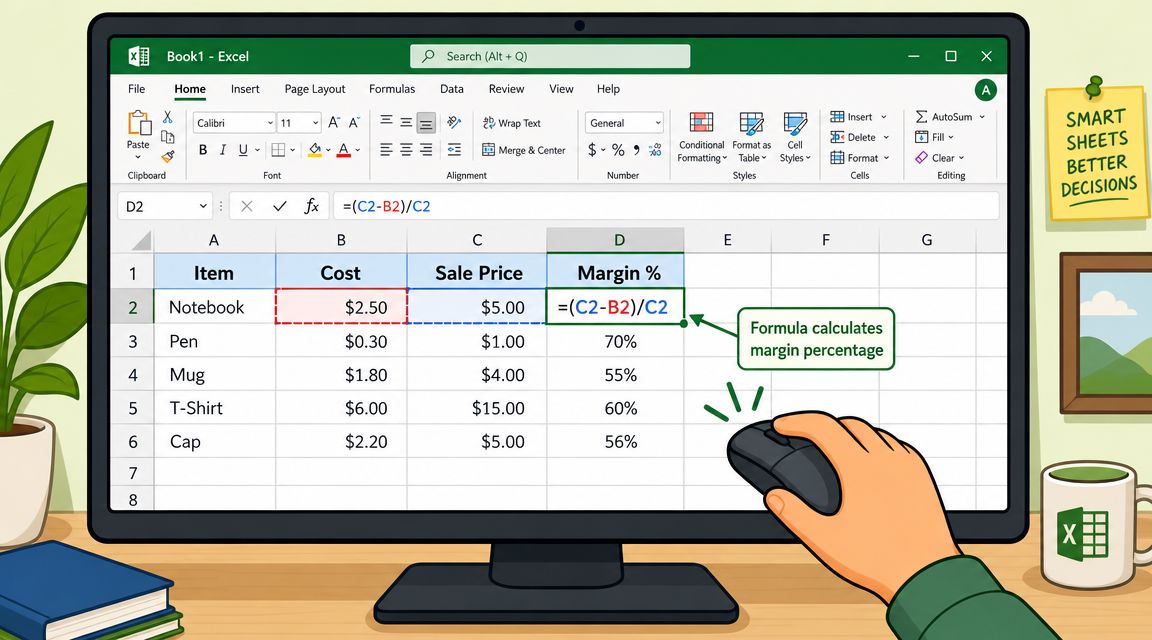
Use one row for headers and keep each field in its own column. A practical starting layout looks like this:
Column | Purpose |
|---|---|
Item or Service | Product name, SKU, job, or service line |
Cost Price | Direct cost tied to the sale |
Selling Price | Revenue charged to the customer |
Profit | Selling price minus cost |
Margin % | Profit divided by selling price |
This structure works because it separates inputs from outputs. Cost and selling price are entered or imported. Profit and margin are calculated. That makes review much easier.
A sound worksheet pattern is to place selling price and cost in dedicated input columns, enter the formula in the first data row, then use Excel’s autofill handle to copy it down so every row stays consistent and auditable, as shown in this Excel walkthrough on building the formula down a full column.
Use formulas that audit cleanly
If your columns are arranged like the table above, the formulas are straightforward:
Profit:
=C2-B2Margin %:
=D2/C2
Format Cost Price and Selling Price as currency. Format Margin % as percentage. That’s not cosmetic. It prevents people from misreading a decimal as a final answer.
A few habits make the file much stronger:
Turn the range into an Excel Table: new rows inherit formulas automatically.
Keep raw inputs raw: don’t type over formula cells to “fix” one odd result.
Add a notes column if needed: unusual transactions should be explained, not patched.
A margin file should tell you what happened, not hide what happened.
If you want a deeper walkthrough of gross margin formulas and worksheet logic, this guide on Excel formula gross margin setup is a useful companion to the template approach.
What works and what doesn’t
What works is boring in the best way. Dedicated columns. One formula per metric. Copy down. Review exceptions.
What doesn’t work is the “quick fix” file that mixes sales summaries, manual journal-style adjustments, and pricing experiments in the same grid. That kind of sheet usually becomes unreadable after a few edits. Keep your basic calculator plain first. Add sophistication later.
Distinguishing Margin from Markup
A pricing file can look perfectly tidy and still produce the wrong answer. I see it when a sales export or invoice dump is pulled into Excel, the profit formula is correct, and the percentage column is not. The sheet says margin. The formula is markup. That error usually survives until someone compares quoted prices to actual gross profit.
They answer different questions
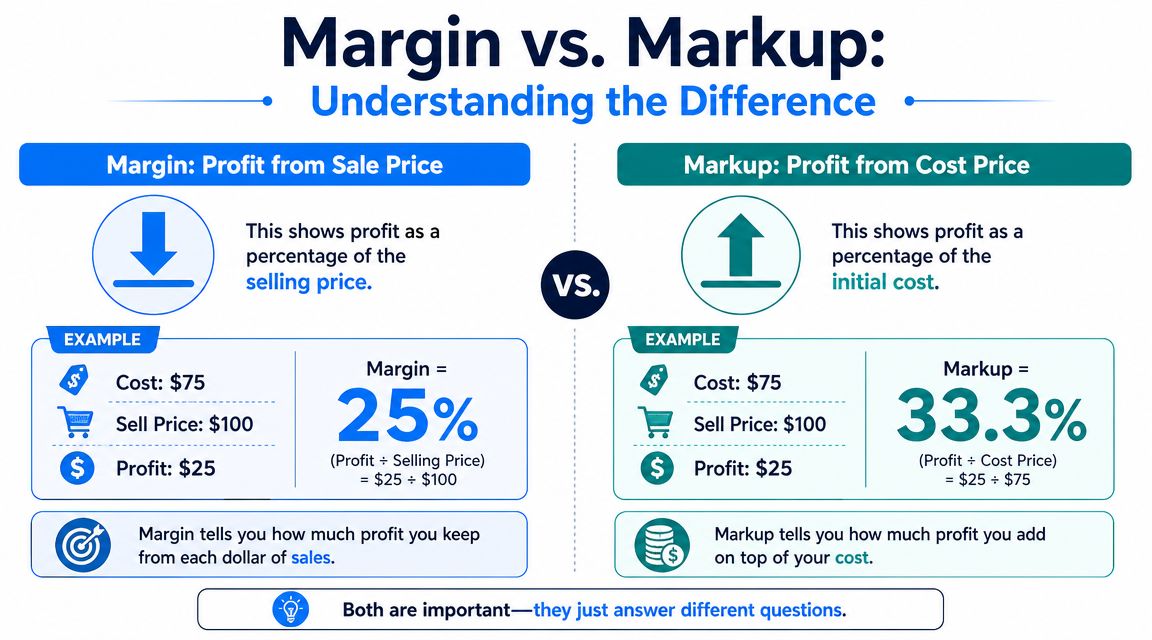
Margin and markup are both valid. They just solve different problems, and Excel will calculate either one without warning you that you picked the wrong denominator.
Metric | Formula logic | Use case |
|---|---|---|
Margin | Profit divided by revenue | Profitability reporting and target margin pricing |
Markup | Profit divided by cost | Cost-based pricing and quote building |
That distinction matters because many spreadsheet users still divide profit by cost and label the result as margin. Making Business Matter’s explanation of margin errors covers that exact mistake.
The quickest way to sanity-check your sheet is to test one simple example. If cost is 80 and selling price is 100, profit is 20. Margin is 20/100, which is 20%. Markup is 20/80, which is 25%.
Same profit. Different percentage.
That difference becomes more important once you stop typing neat sample numbers and start importing live invoice data from a bookkeeping tool such as Booksmate. Export files often include credits, partial shipments, freight, discounts, and line items with missing cost data. If the workbook already confuses margin and markup, those messy rows make the reporting error harder to spot because the percentages still look plausible.
What goes wrong in practice
If a manager asks for a 20% margin and the worksheet applies a 20% markup formula, the selling price comes out too low. The problem then spreads into day-to-day decisions:
Sales quotes start weak: discounts get applied to a price that was already short.
Product reviews look better than reality: underperforming items appear acceptable.
Budget forecasts miss gross profit: expected contribution is overstated.
Margin definitions also need to be explicit. Gross margin, operating margin, and net margin are different measures. Gross margin compares direct cost to revenue. Operating margin includes operating expenses. Net margin includes all expenses. A worksheet that just says “Margin %” invites the wrong interpretation, especially after someone pastes in a fresh export and assumes every tab uses the same logic.
Markup is for building the price. Margin is for checking whether the result is good enough.
In Excel, make that distinction visible. Name the columns Markup % and Gross Margin %. Keep each formula in its own field. If invoice data is imported from another system, map revenue and cost columns before calculating percentages. Clean formulas matter, but clean labels matter just as much when real transaction data starts flowing into the file.
Customizing Your Calculator for Advanced Scenarios
A basic margin sheet usually works until someone asks a harder question. What price keeps us at 35% gross margin after a supplier increase? Which rows should be reviewed first when imported invoice data includes blanks, credits, or inconsistent tax treatment? That is the point where a simple formula needs better structure.
Work backward from a target margin
Plenty of pricing decisions start with cost and a required margin, not with a selling price already chosen. In that case, the calculator needs a reverse pricing formula.
If Cost Price is in A3 and the target Gross Margin % is in B1, use:
=A3/(1-$B$1)
This solves for the sales price needed to hold the target margin. It is a practical formula for live pricing work because one change in cost immediately updates the minimum acceptable selling price.
It is especially useful in a few common cases:
Supplier price changes: update the cost column and review which items now need a higher price.
Category-level targets: keep one target margin cell for a product line and apply it across all rows.
Service quotes: start with expected labor and direct costs, then calculate the quote price required to protect gross profit.
The usual mistake is inputting 35 instead of 35%. Excel reads those very differently. Keep the target margin cell formatted as a percentage, and add an input note if other staff will use the file.
Add controls for messy data
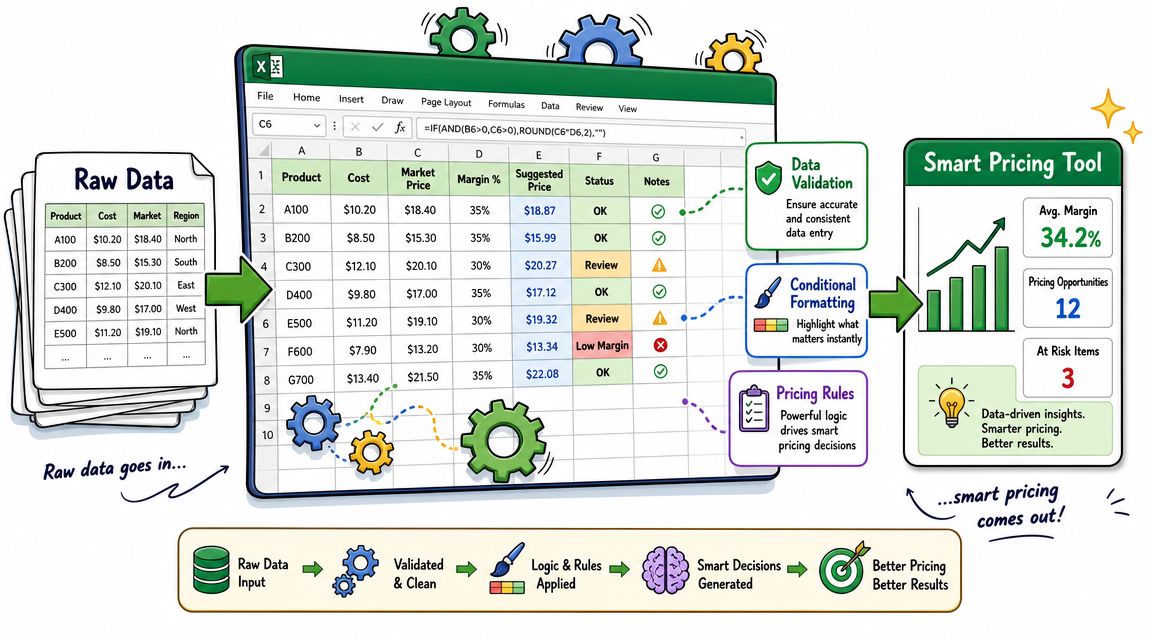
Real invoice exports are rarely clean enough to trust on arrival. Some rows have missing cost values. Some include tax in the line amount. Some use one supplier name five different ways. If the calculator is going to sit on top of exported data from a bookkeeping workflow, those issues need to be handled before the margin result is taken seriously.
Start with Data Validation. Restrict fields such as category, tax status, supplier, and pricing owner to approved lists. That prevents reporting drift caused by inconsistent labels.
Then use Conditional Formatting with rules that reflect how people review exceptions:
Highlight blank cost cells.
Flag negative margins.
Mark margins below the minimum threshold for that category.
Shade rows where revenue exists but cost has not been mapped yet.
That last rule matters when you build the workbook around imported sales and purchase data. If invoice lines come from a system export or from invoice data extraction software for accounting workflows, the calculation layer should make incomplete mappings obvious instead of producing misleading percentages without clear indication.
Build advanced logic in separate columns
Do not cram every adjustment into one long formula. Separate the moving parts so another person can audit the workbook without tracing nested functions for ten minutes.
A practical layout often includes:
Net Sales
Direct Cost
Adjusted Cost
Target Margin %
Required Sales Price
Actual Gross Margin %
Review Flag
Adjusted Cost is where you can account for freight, packaging, merchant fees, or other direct selling costs that get missed in basic templates. If those costs matter to the pricing decision, include them explicitly. If they do not, leave them out on purpose and label the metric clearly as product gross margin rather than full contribution margin.
Use Goal Seek carefully
Goal Seek is useful for one-off questions from management. If a sales manager asks what price is needed to keep a contract above a certain margin, Goal Seek can answer it quickly. It is less useful for repeatable workflows across hundreds of rows.
For repeated pricing reviews, formula-driven columns are better because they recalculate automatically after each data refresh. Goal Seek works best as a spot-check tool, not as the engine of the calculator.
A strong workbook does two things well. It calculates correctly, and it stays readable after real invoice data gets pasted in. That is the difference between an Excel exercise and a calculator a finance team can keep using.
Automating Calculations with Invoice Data
Most margin calculator Excel articles break down at the same point. They assume revenue and cost are already sitting in neat columns, ready for calculation. That’s not how real bookkeeping looks.
Actual source data arrives through invoices, portal downloads, emailed receipts, credit notes, refunds, and exports from payment platforms. Before you can calculate margin, someone has to gather, clean, classify, and line up that data. That’s where the critical effort is.

Build around imported tables, not manual typing
A stronger workflow starts outside the calculator tab. Instead of typing each transaction into a hand-built sheet, import a sales export, purchase ledger, or invoice CSV into Excel and calculate from there.
Practitioner guidance points out that most guides assume clean revenue and COGS inputs, while bookkeepers usually have to build calculators from messy invoice data. A better setup links the calculator to imported invoice tables and can use Power Query to handle real-world prep before the margin formula is applied, as discussed in this Excel margin formula discussion on Microsoft Tech Community.
In practice, that means:
Export source data from your accounting or document system.
Import it with Power Query into a structured Excel table.
Clean and map fields so sales, direct costs, credits, and tax are separated.
Calculate margin from the cleaned table, not from raw dumps.
If your team is still chasing invoices across portals and inboxes before any of that can happen, tools built for invoice data extraction software can reduce the manual collection burden upstream.
Clean the data before you calculate margin
Good accounting judgment matters more than flashy formulas. You need to decide what belongs in direct cost, what belongs in overhead, and what should be excluded from the margin calculation entirely.
Common cleanup points include:
Tax treatment: keep tax separate if margin should be based on net sales and net cost.
Refunds and credit notes: reduce revenue or cost in the right period.
Discounts and rebates: don’t leave them hidden in memo fields.
Foreign currency: convert consistently before comparing margins across transactions.
I prefer a staged workbook structure:
Tab | Purpose |
|---|---|
Raw Import | untouched export from source system |
Query Output | cleaned and standardized transaction table |
Margin Calc | formulas, flags, and reporting views |
That setup works because it preserves an audit trail. You can always trace the margin result back to imported data without wondering who overwrote what.
A margin calculator becomes much more reliable once it’s attached to a repeatable import routine. At that point, Excel stops being a scratchpad and starts acting like a lightweight reporting system.
FAQ for Your Excel Margin Calculator
Most problems after setup come from data treatment, not formula difficulty. The arithmetic is simple. The judgment around inputs is where teams slip.
How should I handle shipping, fees, and rebates
If they are direct costs of the sale, include them in the cost base used for gross margin. The cleanest approach is to create a Total Cost column rather than stuffing everything into one number manually. That keeps product cost, shipping, transaction fees, and other direct charges visible.
For reporting, keep the components separate even if the margin formula uses the total.
Why am I getting errors or strange percentages
The most common issue is a division problem. If selling price is blank or zero, the margin formula can return an error. Wrap the formula in IFERROR if you want a cleaner display, but fix the underlying input as well.
Also check whether someone changed the formula from margin to markup logic. If the percentage looks too high, that’s often the reason. Another frequent problem is inconsistent cost or selling-price values imported from source data.
Can I use the same setup in Google Sheets
Yes. The same logic transfers well. You can use the same column layout, the same basic formulas, and similar formatting rules.
Keep the accounting logic stable across tools. Change the platform if you want. Don’t change the definitions.
If you work with multiple profitability layers, label them clearly. Gross margin, operating margin, and net margin answer different questions. A calculator becomes far more useful when the workbook shows which one you’re measuring and why.
If your Excel model is fine but the hard part is collecting invoices and receipts from portals, marketplaces, and inboxes, Booksmate is worth a look. It helps accountants and bookkeepers automate invoice collection, organize documents in one place, extract the key data, and export it into downstream workflows so your margin reporting starts with cleaner inputs.
If you are comparing formulas, what is the difference between gross margin and markup in excel provides a clear breakdown.