Last updated:
Excel Margin Formula: Gross Margin, Profit Margin & Markup

At its heart, the Excel formula for gross margin is wonderfully simple: =(Revenue - COGS) / Revenue. But don’t let that fool you. This single metric tells a powerful story about how much real profit you’re making on each sale before factoring in things like marketing or rent.
Excel margin formula quick reference
The basic Excel margin formula is =(Selling Price-Cost)/Selling Price. Format the result as a percentage. If selling price is in A2 and cost is in B2, the formula is =(A2-B2)/A2.
Gross margin:
=(Revenue-COGS)/RevenueGross profit percentage: use the same formula and format the result as %.
Markup:
=(Selling Price-Cost)/Cost, which is different from margin.
What is the gross margin formula in Excel?
If revenue is in A2 and cost of goods sold is in B2, use =(A2-B2)/A2 and format the result as a percentage. This returns the share of revenue left after direct costs.
For £10,000 revenue and £4,000 COGS, the result is 60%.
Use =IFERROR((A2-B2)/A2,0) if rows may contain zero revenue.
Do not divide by cost, because that calculates markup rather than margin.
What is the difference between gross margin and markup in Excel?
Gross margin divides profit by selling price, while markup divides profit by cost. With selling price in A2 and cost in B2, margin is =(A2-B2)/A2 and markup is =(A2-B2)/B2.
A £100 sale with £60 cost has 40% margin.
The same sale has 66.7% markup.
Label the cells clearly because confusing the two produces incorrect pricing decisions.
Excel profit margin formula examples
For product-level gross profit margin, put revenue in column A, cost of goods sold in column B and margin in column C. In C2, use =IFERROR((A2-B2)/A2,0), then copy it down the column.
Metric | Excel formula | Use it for |
|---|---|---|
Gross margin |
| Product or sales profitability before operating expenses. |
Profit margin |
| Any profit line as a percentage of sales. |
Markup |
| Pricing uplift over cost. |
This is why “margin formula” searches are easy to get wrong. If you divide by cost, you are calculating markup. If you divide by revenue or selling price, you are calculating margin.
Why Gross Margin in Excel Is Your Business Health Scorecard
Before we get into the nitty-gritty of spreadsheet formulas, let’s talk about why this number is so important. Think of gross margin as a direct look into your business’s core profitability and efficiency. It’s your first line of financial defense, giving you a quick, honest read on your pricing strategy and cost control.
A falling gross margin is an immediate red flag. I’ve seen it happen many times. For an e-commerce bookkeeper, a seemingly small dip from 45% to 41% in one quarter is a huge deal. It might mean a key supplier jacked up their prices, or that your latest promotional discounts are eating away at profits more than you planned. If you aren’t tracking this, these issues can quietly spiral out of control.
Setting Realistic Benchmarks
Now, what’s a “good” gross margin? It completely depends on your industry. Trying to compare a software company to a retailer is like comparing apples and oranges.
Retail and E-commerce: These businesses often run on thinner margins. A healthy gross margin might be in the 20-40% range, which works because they rely on high sales volume.
Software and Digital Products: On the other hand, these industries can have incredible margins, often 70-90% or even higher. Why? Because after the initial development, the cost to sell one more unit is practically zero.
To really get a feel for its power as a ‘business health scorecard’, it’s worth digging into what gross margin percentage means in different real-world scenarios. Knowing your industry’s average is the first step to setting goals that actually make sense for your business.
A strong gross margin is the bedrock of a profitable company. It’s the ultimate proof that your core model—selling something for more than it costs you—is working. All your other expenses, from marketing campaigns to office snacks, are paid for by the profit you generate right here.
Ultimately, getting a handle on the gross margin formula in Excel isn’t just about plugging in numbers. It’s about building a system that gives you the clarity to make smart, strategic moves—whether that’s renegotiating with a supplier, tweaking your prices, or finally cutting an unprofitable product line loose.
Alright, let’s get our hands dirty and build the actual Excel formula for gross margin. This is where the theory becomes a practical tool you can use every day.
The core logic is refreshingly simple. You’re just taking your profit and dividing it by your revenue.
(Revenue - Cost of Goods Sold) / Revenue
This little formula is the backbone of all profitability analysis in a spreadsheet. It’s the same logic whether you’re selling software or handmade goods, a concept explored in more detail in this guide on Mastering the Product Margin Calculation Formula.
To get this right in Excel, you first need to know what each piece of the puzzle represents.
Core Components of the Gross Margin Formula
Here’s a quick reference table breaking down the elements we’ll be using in our formula. Think of these as the ingredients for our calculation.
Component | What It Represents | Example Excel Cell |
|---|---|---|
Revenue | The total income generated from selling a product. |
|
COGS | The direct costs to produce or acquire that product. |
|
Gross Margin | The percentage of revenue left after covering COGS. |
|
Having your data neatly organized like this is half the battle. Now, let’s plug in some real numbers.
Imagine you sell handmade ceramic mugs. Your spreadsheet might have a row for a specific sale that looks like this:
Cell B2 (Revenue): $25
Cell C2 (COGS): $10
Building the Formula
Now for the magic. In cell D2, where you want your gross margin percentage to live, you’ll type this formula:
=(B2-C2)/B2
Pay close attention to the parentheses. They are absolutely critical. They tell Excel to first figure out your profit (B2-C2) before it divides by your revenue (B2). If you forget them, Excel’s order of operations will mess things up by dividing C2 by B2 first, and your result will be completely wrong.
Once you hit Enter, you’ll see 0.6. That’s the right answer, but it’s not very intuitive. To make it instantly understandable, just select cell D2 and click the Percent Style (%) button on the Home tab.
I can’t stress this enough: always format your margin cells as a percentage. It’s a small habit that makes a world of difference. An abstract number like
0.6becomes a clear, powerful metric: 60%. This simple click prevents confusion and makes your financial reports speak for themselves.
And just like that, you know that for every $25 mug you sell, 60% of the revenue is pure profit after you’ve paid for the materials and labor.
You now have a reliable excel formula gross margin that you can drag down an entire column to analyze hundreds or even thousands of products in seconds. This is the first, most important step to seeing which products are actually making you money.
Alright, you’ve got the hang of calculating gross margin for a single product. But what happens when you need to see the bigger picture? Manually calculating the margin for hundreds or thousands of products one by one is a recipe for a headache.
This is where you can really let Excel do the heavy lifting. To move from looking at individual items to analyzing entire product lines, categories, or sales periods, we need to bring out some more powerful functions. Think of it as switching from a magnifying glass to a wide-angle lens for your company’s profitability.
Functions like SUM, SUMIF, and SUMPRODUCT are your best friends for this kind of macro analysis. They let you aggregate all your revenue and costs first, then calculate the margin on those totals. This gives you a true, weighted-average view of your performance.
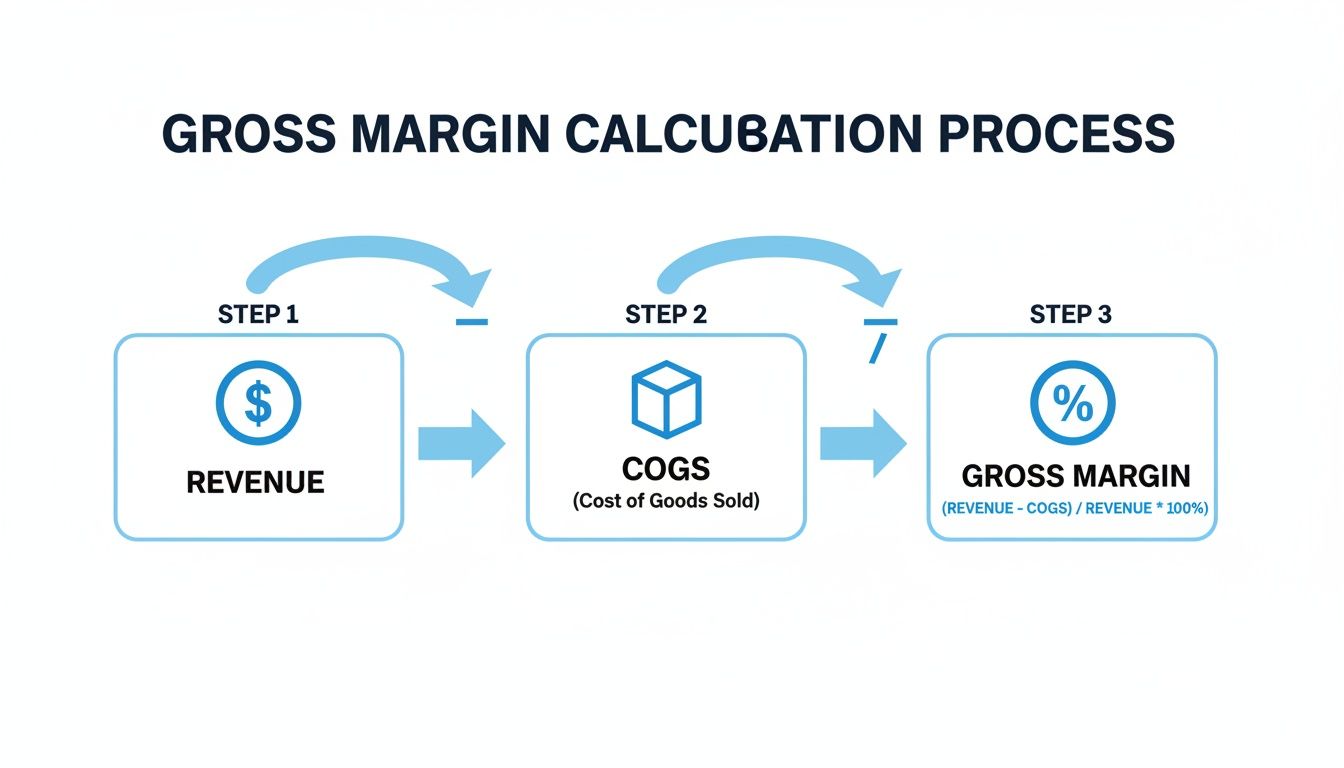
The key takeaway here is to sum everything up before you do the final division. If you just average your individual margin percentages, you’ll get a skewed number that doesn’t accurately reflect your business’s health.
Calculate Total Gross Margin with SUM
The most straightforward way to get a bird’s-eye view is by calculating the total gross margin for a whole list of items. It’s a fantastic, quick health check. To do this, you simply sum up all your revenue and all your costs of goods sold (COGS) separately.
Let’s say your revenue is listed in cells B2:B100 and the corresponding COGS are in C2:C100. Here’s the formula you’d use:
=(SUM(B2:B100)-SUM(C2:C100))/SUM(B2:B100)
This single Excel formula for gross margin gives you one powerful metric: the overall profitability of that entire list. It’s perfect for quickly assessing a sales quarter or the performance of your entire inventory.
Isolate Categories with SUMIF
But what if you need to get more granular? Maybe you want to know the gross margin for just your “Electronics” category, especially when your spreadsheet is a mixed bag of products. This is the perfect job for the SUMIF function. It lets you sum numbers only if they meet a certain condition.
Imagine you have a ‘Category’ column in A2:A100. To find the gross margin for only the “Electronics” items, the formula gets a bit longer but is incredibly powerful:
=(SUMIF(A2:A100, "Electronics", B2:B100) - SUMIF(A2:A100, "Electronics", C2:C100)) / SUMIF(A2:A100, "Electronics", B2:B100)
Here’s what’s happening under the hood:
SUMIF(A2:A100, "Electronics", B2:B100)scans your category column and adds up the revenue only from rows labeled “Electronics.”The formula does the exact same thing for the COGS in column C.
Finally, it calculates the gross margin using these category-specific totals.
This technique is a lifesaver for comparing different product lines. You can quickly see which categories are your profit powerhouses and which might be lagging.
I lean on
SUMIFall the time when building summary dashboards. It allows me to create a clean, high-level report showing the gross margin for each business unit without ever having to manually filter or sort the raw data. It’s a massive time-saver.
Use SUMPRODUCT for Weighted Averages
For the absolute most efficient analysis, especially with large datasets, my go-to is SUMPRODUCT. This function is a bit more advanced but it’s a true game-changer. It can calculate your total gross profit dollars (Revenue - COGS) across your entire list in one shot, without needing a “helper column.”
The SUMPRODUCT function works by multiplying corresponding numbers in different arrays (or columns) and then summing up the result. It’s elegant and powerful.
To get your total gross margin, you can use it like this:
=SUMPRODUCT(B2:B100-C2:C100)/SUM(B2:B100)
In this formula, SUMPRODUCT(B2:B100-C2:C100) is doing some behind-the-scenes magic. It creates a temporary list of the gross profit for each individual row and then adds them all up. You then divide that total gross profit by your total revenue to get a perfectly weighted average gross margin.
This is, by far, the most scalable and clean Excel formula for gross margin when you’re dealing with lots of data.
Troubleshooting Common Excel Margin Formula Errors

Nothing stops a financial analysis faster than a broken formula. The good news? Most Excel errors are surprisingly easy to fix once you know what you’re looking for. When you’re calculating gross margin, you’re bound to hit a few common roadblocks.
Let’s talk about the classic culprit: the #DIV/0! error. We’ve all been there. This ugly little message appears when your formula tries to divide by zero, which is a mathematical impossibility.
In the context of our gross margin formula—(Revenue - COGS) / Revenue—this happens whenever the Revenue cell is either 0 or completely blank. This is a pretty common scenario, especially if you have a new product line with no sales yet or if a data import simply missed a few entries. The error itself isn’t wrong, but it looks messy and can cause a chain reaction of errors in any other calculations that rely on that cell.
The IFERROR Fix
The most elegant way to handle this is by wrapping your formula in the IFERROR function. It’s a lifesaver. This function basically tells Excel to try a calculation, and if it fails, to show something else instead of an error message.
Instead of the basic formula, you’ll want to use this: =IFERROR((B2-C2)/B2, 0)
What this formula is really saying is:
First, try to calculate the gross margin with
(B2-C2)/B2.If that works, great! Show the result.
But, if you get an error (like our
#DIV/0!friend), just show a 0 instead.
This one simple tweak keeps your spreadsheet clean, professional, and functional. An item with no revenue will now correctly show a 0% margin (once you format it as a percentage), which is exactly what makes sense.
Fixing Common Formatting and Value Errors
Sometimes your formula is technically correct, but the output still looks off. I see this happen all the time, usually due to simple formatting slip-ups or unexpected text in a cell.
Result shows
0.25instead of25%: This isn’t really an error, just a display issue. Your math is spot on, but the cell is formatted as a plain number. To fix it, just select the cell (or the whole column) and click the Percent Style (%) button on the Home tab.The
#VALUE!Error: This one pops up when your formula encounters text where it expects a number. I can’t tell you how many times a stray “N/A” or even a single accidental space in a revenue or COGS cell has caused this. Just double-check your data to make sure every cell in your calculation contains only numbers.
Getting into the habit of using
IFERRORand keeping a close eye on your formatting does more than just fix errors—it helps you build smarter, more robust financial reports. It’s a small step that prevents major headaches later on and ensures your analysis is always accurate and ready to present.
Keeping Your Data Clean for Accurate Margin Calculations
Let’s be honest: your Excel formulas are only as good as the numbers you put into them. You can craft the perfect SUMPRODUCT or IFERROR function, but if your revenue and COGS figures are off, the results are just fiction. This is where the neat world of spreadsheets collides with the messy reality of bookkeeping.
The single biggest roadblock to an accurate gross margin is manual data entry. Slogging through hundreds of supplier invoices, sales receipts, and platform statements isn’t just mind-numbing; it’s practically an invitation for errors. A single typo or a misplaced invoice can quietly throw off your entire profitability analysis.
This problem is especially painful for e-commerce businesses juggling a dozen different sales and payment platforms. If you’re a bookkeeper buried in invoices from Amazon, Stripe, and PayPal, you know the drill. Industry estimates show manual invoice processing can chew up 20-30 hours a week per accountant and lead to errors that skew gross margins by as much as 5-10%. Clean data isn’t a luxury; it’s the foundation of a healthy business. You can explore detailed profit margin data to see how thin the margins can be in some sectors.
Ditching Manual Entry for an Automated Workflow
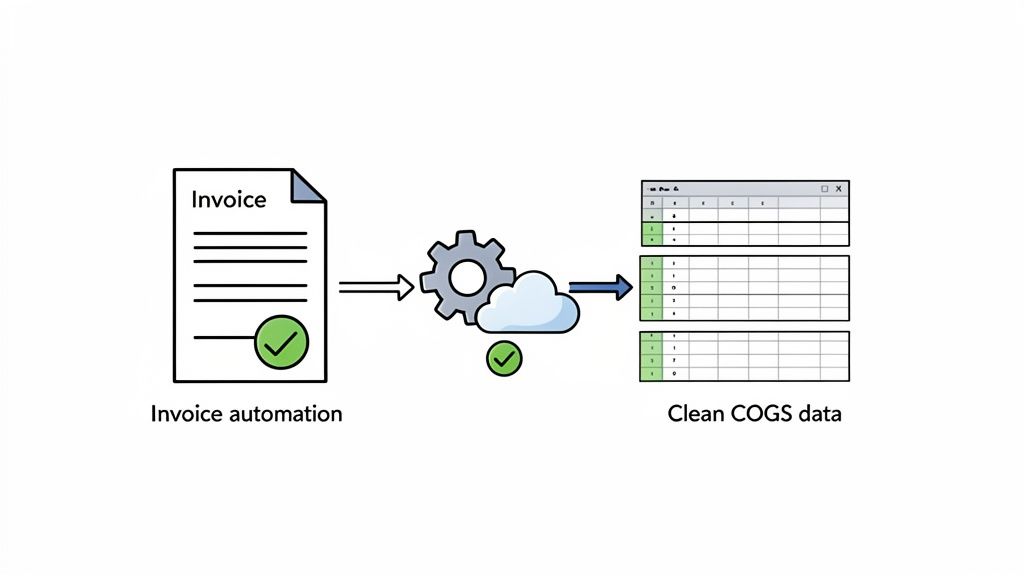
To get numbers you can actually trust, you have to fix the data at the source. That means moving away from the keyboard and embracing an automated workflow. Modern tools are built to do the heavy lifting for you by connecting directly to your various business accounts.
For example, an invoice automation tool like Booksmate can be set up to handle the entire collection process:
It logs into your supplier portals (like Amazon Business or Microsoft) for you.
It grabs every new invoice and receipt the moment it’s available.
It even scans your email inboxes for receipts from services like Google Ads or Stripe.
This kind of system ensures no document slips through the cracks, giving you a complete and verifiable record of your expenses without the risk of human error.
Turning Raw Invoices into Spotless Data
Once all your invoices are collected, the next challenge is getting the information out of them accurately. Instead of having someone type everything by hand, AI-powered tools can read the documents for you. They intelligently identify and pull key details like total cost, line-item specifics, and invoice dates.
This extracted data is then neatly organized into a clean, structured file—like a CSV—that’s ready for Excel. You can import it knowing that every single number perfectly matches the source document.
The real power comes when your
excel formula gross marginis fueled by automated data. You’re no longer just calculating a number; you’re analyzing a true reflection of your business’s health, free from the static of manual mistakes.
Ultimately, this modern approach to bookkeeping completely changes the game. Instead of losing hours to tedious data entry, you can spend your time on what actually matters: analyzing the insights your accurate gross margin calculations provide and making smarter, more profitable decisions.
Frequently Asked Questions About Excel Gross Margin
Once you’ve got the basic Excel formula for gross margin down, you’ll find that real-world situations always bring up new questions. Let’s walk through a few of the most common ones I hear from people trying to nail down their reporting.
Getting these details right is what separates a decent spreadsheet from a truly insightful one.
What Is a Good Gross Margin Percentage
This is the million-dollar question, and the honest answer is: it completely depends on your industry. There’s no single number that works for everyone.
A retail business might do just fine with a 25% gross margin because they move a high volume of products. On the other hand, a software company would see that same 25% as a major red flag.
Retail/E-commerce: You’ll often see margins in the 20% to 50% range. The business model is built on volume.
Software/SaaS: These businesses can have incredibly high margins, often 70% to 90%, since the cost to sell one more “unit” is nearly zero.
Your best bet is to do a little research on your specific industry. Knowing the benchmarks will tell you if you’re on the right track or if there’s room to improve.
How Do I Calculate Gross Margin for an Entire Year
This is where your data organization really pays off. If you have a dedicated “Date” column in your spreadsheet, this becomes pretty straightforward with a more advanced formula.
The SUMIFS function is your best friend here. It lets you add up numbers that meet multiple criteria—like falling within a specific date range.
For example, to get your gross margin for 2026, you’d use SUMIFS to find the total revenue between January 1, 2026, and December 31, 2026. Then, you’d do the exact same thing for your COGS. Plug those two totals into the classic gross margin formula: =(Total_Annual_Revenue - Total_Annual_COGS) / Total_Annual_Revenue.
Can I Use a PivotTable to Calculate Gross Margin
You bet. In fact, it’s one of the best ways to create a dynamic report that you can easily play with. PivotTables are built for slicing and dicing data without needing to write a bunch of complicated formulas from scratch.
It’s surprisingly easy. Drag your product names into the ‘Rows’ area, then pull ‘Revenue’ and ‘COGS’ into the ‘Values’ area (make sure they’re set to SUM). The real power move is using a ‘Calculated Field’. In the PivotTable Analyze tab, you can create a brand new field called “Gross Margin” and just type in the formula
=(Revenue - COGS) / Revenue. It will instantly calculate the margin for every row.
What’s the Difference Between Gross Margin and Markup
This is a common mix-up, but the difference is huge for understanding your profitability. They both look at profit, but they measure it against different things.
Gross Margin shows profit as a percentage of your revenue (the selling price). It answers the question, “For every dollar in sales, how many cents are actual profit?” Formula: Profit / Revenue
Markup, on the other hand, shows profit as a percentage of your cost. It answers the question, “How much did I increase the price from what it cost me?” Formula: Profit / Cost
Ready to make sure the data feeding your Excel formulas is always clean and accurate? Booksmate automates the mind-numbing work of collecting and processing invoices. You can finally stop wrestling with manual data entry and start trusting the numbers in your reports. Find out how you can save time and make smarter decisions.
To connect profitability analysis with everyday spending, use an Excel expense tracker template alongside your margin workbook.
For reporting structure, what should an excel expense report template include is a useful companion resource.
For spreadsheet modeling support, explore profit margin calculations in Excel with our dedicated calculator guide.