Last updated:
Free Excel Expense Tracker & Expense Report Template

Your receipts are in three places. Some are still sitting in email threads, a few came from vendor portals you meant to revisit, and the rest were typed into a spreadsheet that no longer matches your bank activity. That’s usually when people start searching for an excel template expense tracker.
That search makes sense. Excel is still the fastest way to bring order to messy expense records without changing your whole process overnight. If you want a system you can open today, customize in an hour, and confidently trust next month, a well-built template is a solid place to start.
Why an Excel Expense Tracker Is Your Best First Step
Free Excel expense report template
An Excel expense report template is the version you use when expenses need to be submitted, reviewed, reimbursed or handed to an accountant. It should include the reporting period, employee or business name, supplier, date, category, business purpose, payment method, tax, total amount and receipt reference.
Use one row per transaction so totals and filters work cleanly.
Keep reimbursable expenses separate from company-paid expenses.
Add approval status, reviewer notes and receipt links if the file is used by a team.
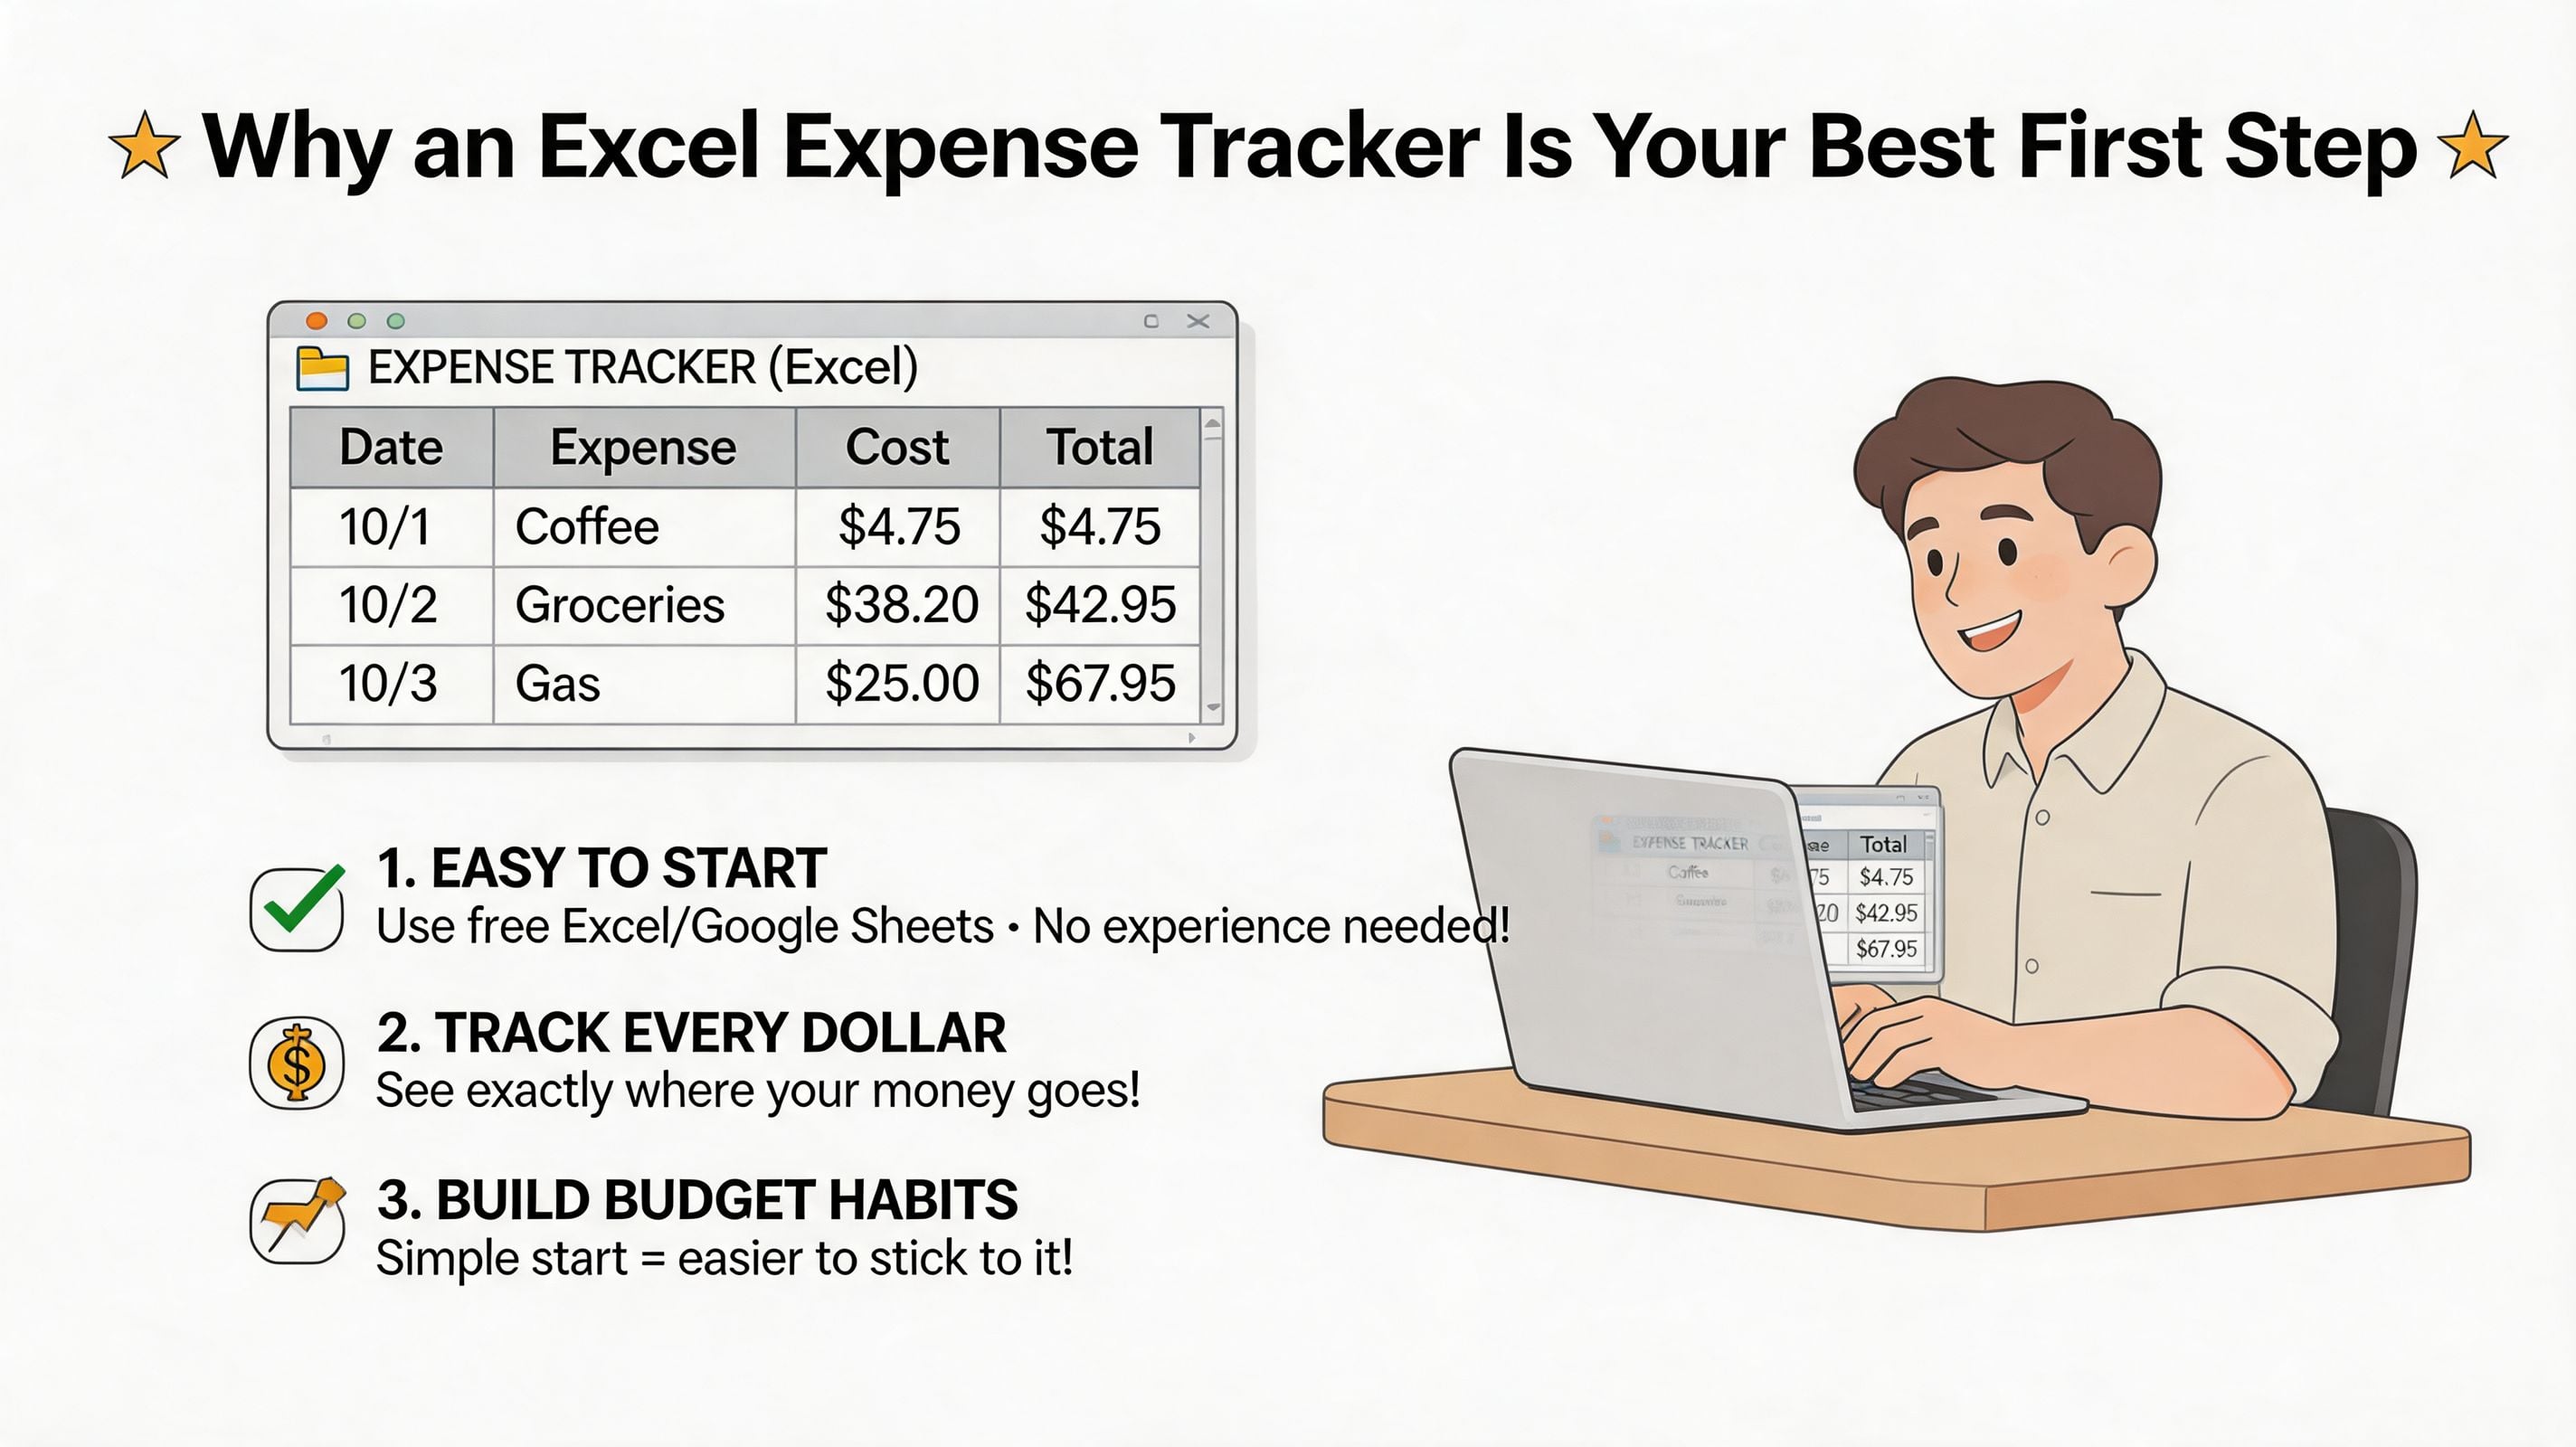
A lot of bookkeeping cleanup starts with the same problem. Expenses exist, but they don’t exist in one system. They’re spread across card statements, inboxes, portals, and handwritten notes. Before you can analyze anything, you need one dependable place to capture the basics.
That’s where Excel earns its keep. It’s familiar, flexible, and forgiving. You can keep the layout simple at first, then add rules, formulas, and reports as your process improves.
Excel has been doing this work for a long time. Expense tracker templates became a foundational part of financial management in the early 2000s, and by 2010, over 750 million Microsoft Office users relied on Excel for business tasks. Modern templates can reduce manual errors by up to 80% and cut processing time from hours to minutes, according to Smartsheet’s overview of Excel expense report templates.
Why Excel works better than a blank notebook
A blank spreadsheet isn’t enough. A template matters because it gives structure to the parts people usually skip.
Consistent columns: Date, category, description, amount, and payment method give you enough detail to review expenses later.
Built-in formulas: Totals update automatically instead of relying on mental math and manual subtotals.
Easy cleanup: You can sort, filter, and scan for duplicates or odd transactions quickly.
Better handoff: If you share records with an accountant or another bookkeeper, a clean Excel file is easier to review than screenshots and forwarded emails.
Practical rule: If you can’t sort your expense log by category and month in a few clicks, the setup is too loose.
I also like Excel because it sits in the middle. It’s more useful than a notepad and less disruptive than jumping straight into a full software rollout. For small businesses, freelancers, and lean finance teams, that middle ground is often exactly what’s needed.
There’s also a broader reporting benefit. Once your expenses live in a structured worksheet, it becomes much easier to tie them into other financial reviews. If you also need to automate P&L report processing, keeping your expense data organized in Excel makes those downstream tasks much less painful.
What this template should do for you
A good excel template expense tracker shouldn’t try to be everything. It should do a few jobs well:
What you need | What the template should handle |
|---|---|
Daily logging | Fast entry with clear columns |
Monthly review | Category totals and filtered views |
Reimbursement support | Notes, payment method, and payee detail |
Better decisions | A dashboard that shows where money is going |
If that’s the standard, Excel is not a compromise. It’s a practical first system.
How do you create an expense tracker in Excel?
Create a table with Date, Supplier, Description, Category, Payment Method, Net, Tax and Total columns. Convert it to an Excel Table so filters, formulas and new rows expand automatically.
Use data validation for consistent expense categories.
Add a SUMIFS summary by month and category.
Keep receipt or invoice links in a separate Source Document column.
What should an Excel expense report template include?
A useful Excel expense report needs transaction detail, evidence and an approval summary. At minimum include employee or business name, reporting period, date, supplier, category, business purpose, payment method, amount, tax and receipt reference.
Separate reimbursable and company-paid expenses.
Include totals by category and currency.
Protect formula cells while leaving input rows editable.
Your Template Download and First Entries
Start with a file that has one job. Capture every expense in one clean table. Don’t overbuild it on day one.
If you’re using this as your main excel template expense tracker, your entry sheet should include these columns:
Date
Category
Description
Amount
Payment Method
Vendor or Payee
Notes
That may look basic, but each field solves a specific bookkeeping problem.
Set up the entry sheet correctly
Date comes first because timing changes the meaning of an expense. A software renewal booked this month affects a review very differently than the same charge sitting in last quarter.
Category is the most important reporting field. If you skip category discipline early, every monthly review turns into cleanup work. Even a simple dropdown list is enough to keep this under control.
Description should answer, “What was this for?” Don’t write “lunch” if the better entry is “client lunch after proposal meeting.” The extra context helps later when you’re scanning for duplicates, reimbursements, or questionable business use.
Amount should always be entered as one consistent number format. Don’t mix symbols, text, and manual notes in the same cell. Keep the amount cell numeric so formulas and summaries work without repair.
Payment Method earns its column because it helps with reconciliation. If you ever have to answer whether an expense was paid by company card, personal card, bank transfer, or cash, you’ll be glad this detail is separate.
Your first five entries matter more than your first fifty
People usually stall because they think they need to backfill everything before the file is useful. You don’t. Start with the most recent expenses and build momentum.
A simple example:
Enter the date of the purchase.
Choose Meals as the category.
Write a useful description, such as “Coffee meeting with freelance designer.”
Add the amount.
Mark the payment method, such as business credit card.
Add the vendor, if you track it.
Use notes only when the expense needs extra explanation.
The best spreadsheet setups reduce friction. If entering one expense feels slow, the template needs fewer decisions, not more tabs.
After a few entries, convert the range to an Excel Table. That gives you filter arrows, cleaner formatting, and formulas that expand as new rows are added. It also makes later reporting much easier.
If you move between Excel and Google Sheets
Some teams start in Excel and later need shared access in Google Sheets. That’s workable, but do the transfer carefully so formulas, dropdowns, and formatting don’t break. If you need that handoff, this guide for efficient data transfer is worth reviewing before you migrate the file.
One final setup note. Don’t mix raw entries with monthly summaries on the same sheet. Keep your data entry tab clean. The less clutter there is, the less likely someone will type over a formula or sort only part of the file by mistake.
Business expense tracker vs expense report template
A business expense tracker is an ongoing ledger. An expense report template is usually a packaged summary for a period, trip, client, employee or reimbursement claim. If you want the same workbook to do both jobs, keep raw transactions in one sheet and create a separate report tab that pulls totals from that data.
Need | Best Excel structure |
|---|---|
Company expense tracker | One running transaction table with categories, suppliers and receipt links. |
Business expense report | A period-based summary with employee, approval and reimbursement fields. |
Expense sheet template | A simple entry sheet for date, description, category, amount and payment method. |
The best way to track business expenses in Excel is to avoid mixing those jobs in one messy tab. Enter transactions once, then let formulas and filters produce monthly summaries, reimbursement reports and accountant-ready exports.
Customizing Your Tracker with Categories and Formulas
A tracker starts earning its keep when the entries turn into consistent data. The goal here is simple. Make every new row easy to enter, easy to total, and hard to break.
I usually set up two things before anything else on this sheet. A controlled category list, and formulas that pull totals from the raw data without hand-editing each month. That keeps the workbook useful while it is still manual, and it also makes the file much easier to connect to automated feeds later if you decide to pull transactions in from Booksmate instead of typing them one by one.
Build category dropdowns that stay useful after month one
Categories should reflect how you review spending, not every tiny difference between purchases. Too many options slow entry down. Too few make the reports vague.
Create a second sheet called Categories and keep one category in each cell down a single column. Then apply Data Validation to the Category column on your entry sheet so users choose from that list instead of free-typing.
A solid starting set looks like this:
Meals
Travel
Software
Office Supplies
Marketing
Contractors
Utilities
That setup solves a few common problems fast:
Typos stop splitting totals
Entry gets quicker
Reports stay consistent
If you need more detail, add it with a purpose. For example, I often split Marketing from Ad Spend because owners usually want those reviewed separately. On the other hand, I would not split office purchases into five micro-categories unless someone is making decisions from that level of detail.
Keep category names stable. Renaming “Software” to “Apps” halfway through the year creates cleanup work you do not need.
Use SUMIFS to build summaries you can trust
Once categories are controlled, add a summary area that reads directly from the entry table. SUMIFS is my default because it is easy to audit and flexible enough for most small business trackers.
A basic version looks like this:
=SUMIFS(Amount_range, Category_range, "Meals")
That works for one category total. For a summary table you can reuse every month, reference cells instead of typing category names into the formula.
A practical layout is:
Summary field | Example |
|---|---|
Category cell | Meals |
Period cell | Jan-25 |
Formula logic | Sum amounts where category and period match |
If your raw data has a Month-Year helper column, use a pattern like this:
=SUMIFS($E:$E,$B:$B,$B$1,$C:$C,$A2)
In that example:
$E:$Eis the Amount column$B:$Bis the Month-Year column$C:$Cis the Category column$B$1holds the selected period$A2holds the category name
That formula gives you a summary grid that updates as new rows are added. It is one of the reasons I prefer setting the raw data up carefully. Good structure saves more time than fancy formatting.
If you want Excel’s own reference on the function, Microsoft’s guide to SUMIFS is clear and worth bookmarking.
The formula issue that causes the most cleanup
Formula problems usually come from references drifting after someone copies a cell, inserts a row, or rewrites part of the summary. The fix is not complicated, but it does require discipline.
Use absolute references where the source range should stay fixed. Leave references relative only where you want the summary cells to shift as you copy across or down.
A few habits make these sheets much more reliable:
Lock source ranges with
$Keep headers short and clear
Test one total against a manual check
Avoid merged cells in any area touched by formulas
Store raw data and summaries on separate sheets
One more practical point. If your formulas are getting harder to maintain every month, the workbook is telling you something. Manual Excel tracking is still a strong first step, but it has a ceiling. Once transaction volume increases, the next improvement is usually not a more complicated formula. It is feeding cleaner data into the sheet automatically through a tool like Booksmate, then letting Excel handle the review and reporting.
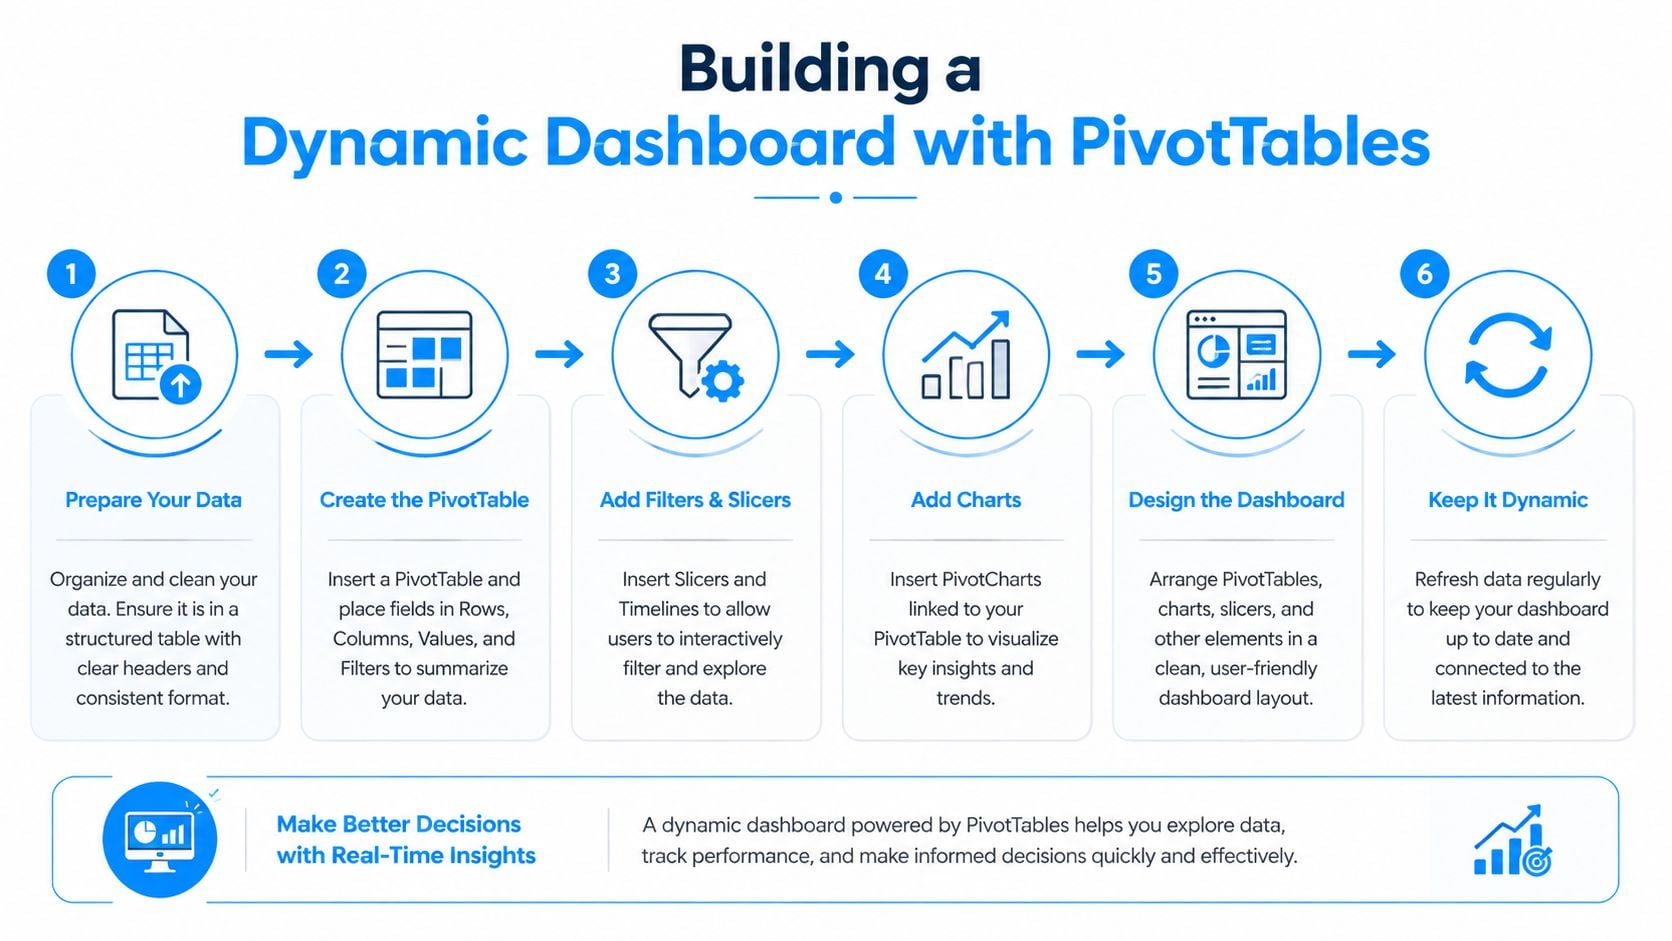
Building a Dynamic Dashboard with PivotTables
A good expense tracker earns its keep when someone asks a simple question and you can answer it in under a minute. How much went to software last quarter? Which card is carrying recurring subscriptions? Which category is drifting up faster than expected?
PivotTables are the fastest way to get there inside Excel. They turn a flat transaction list into a report you can sort, filter, and refresh without rebuilding your formulas every month.
Build the dashboard from one clean source
Start from the raw expense table, then insert the PivotTable on its own sheet. If the source data is already structured well, the setup takes only a few minutes. If it is not, PivotTables expose the mess quickly. Misspelled categories, blank dates, and mixed text and number formats show up right away.
For a practical first dashboard, use this layout:
Rows: Category
Values: Sum of Amount
Columns: Month-Year
Filters: Payment Method or Vendor
That gives you a monthly spending matrix that business owners can read without explanation. In bookkeeping work, this is usually the first view that leads to useful follow-up questions.
Add visuals that help review, not decoration
Once the PivotTable is working, add a PivotChart. A clustered column chart is usually the best place to start because it makes category changes across months easy to compare. Line charts work well for a small number of categories over time. Pie charts are rarely useful unless you are showing a very short list of broad categories.
Keep the dashboard tight. One table, one chart, and two or three filters is enough for most small business reviews.
A useful dashboard often includes:
Dashboard element | Why it matters |
|---|---|
PivotTable by category and month | Shows spending patterns by period |
PivotChart | Makes spikes and drops easier to spot |
Filter by payment method | Helps check card usage and reconciliation issues |
Filter by vendor | Surfaces repeat charges and duplicates |
Category sorting | Puts the largest expenses at the top |
Use slicers if other people will touch the file
Slicers make a big difference in shared workbooks. Instead of opening tiny filter menus inside the PivotTable, users can click visible buttons for Category, Payment Method, Project, or Employee. That cuts down on filter mistakes and makes review meetings move faster.
I recommend slicers for any field people ask about more than once. If no one ever filters by employee, leave it out. Too many slicers make the page harder to read and tempt people to click around instead of reviewing the actual numbers.
A dashboard should answer spending questions without sending people back to the raw data sheet.
Group dates properly and watch the categories that drift
If your dates land in the PivotTable as individual transactions instead of months, right-click a date and use Group to summarize by months, quarters, or years. That one fix turns a noisy report into something management can review.
Trendlines can help too, especially for categories like travel, meals, or software subscriptions where increases happen gradually. They are not proof of a problem on their own, but they give you a fast visual prompt to check the underlying transactions. Microsoft’s guidance on creating a PivotTable to analyze worksheet data is a solid reference if you want the exact Excel steps.
What works in practice
What works:
One source table with consistent headers
A separate dashboard sheet
Clear charts with readable labels
Slicers only for fields people use
Date grouping that matches how you review spending
What causes trouble:
Pulling from scattered ranges
Mixing manual totals into the Pivot area
Letting category names drift month to month
Cramming five chart types onto one tab
Treating the dashboard as a replacement for reviewing source transactions
There is also a trade-off worth calling out. PivotTables are excellent at summarizing clean data. They do very little to fix bad inputs. If vendor names arrive three different ways or receipts are missing, the dashboard will still refresh, but the summary will be less trustworthy. That is why many teams pair Excel reporting with strategies for data automation and, once volume grows, a feed from Booksmate. Excel stays useful. The manual cleanup shrinks.
Automate Data Entry by Connecting to Booksmate
Every Excel tracker runs into the same wall. The reporting can be excellent, but the raw entry work still takes time. Someone has to collect invoices, open receipts, copy amounts, standardize vendor names, and paste everything into the sheet.
That’s manageable when volume is low. It gets old fast when you’re dealing with platforms like Amazon, Stripe, Google, Microsoft, PayPal, and a crowded finance inbox.
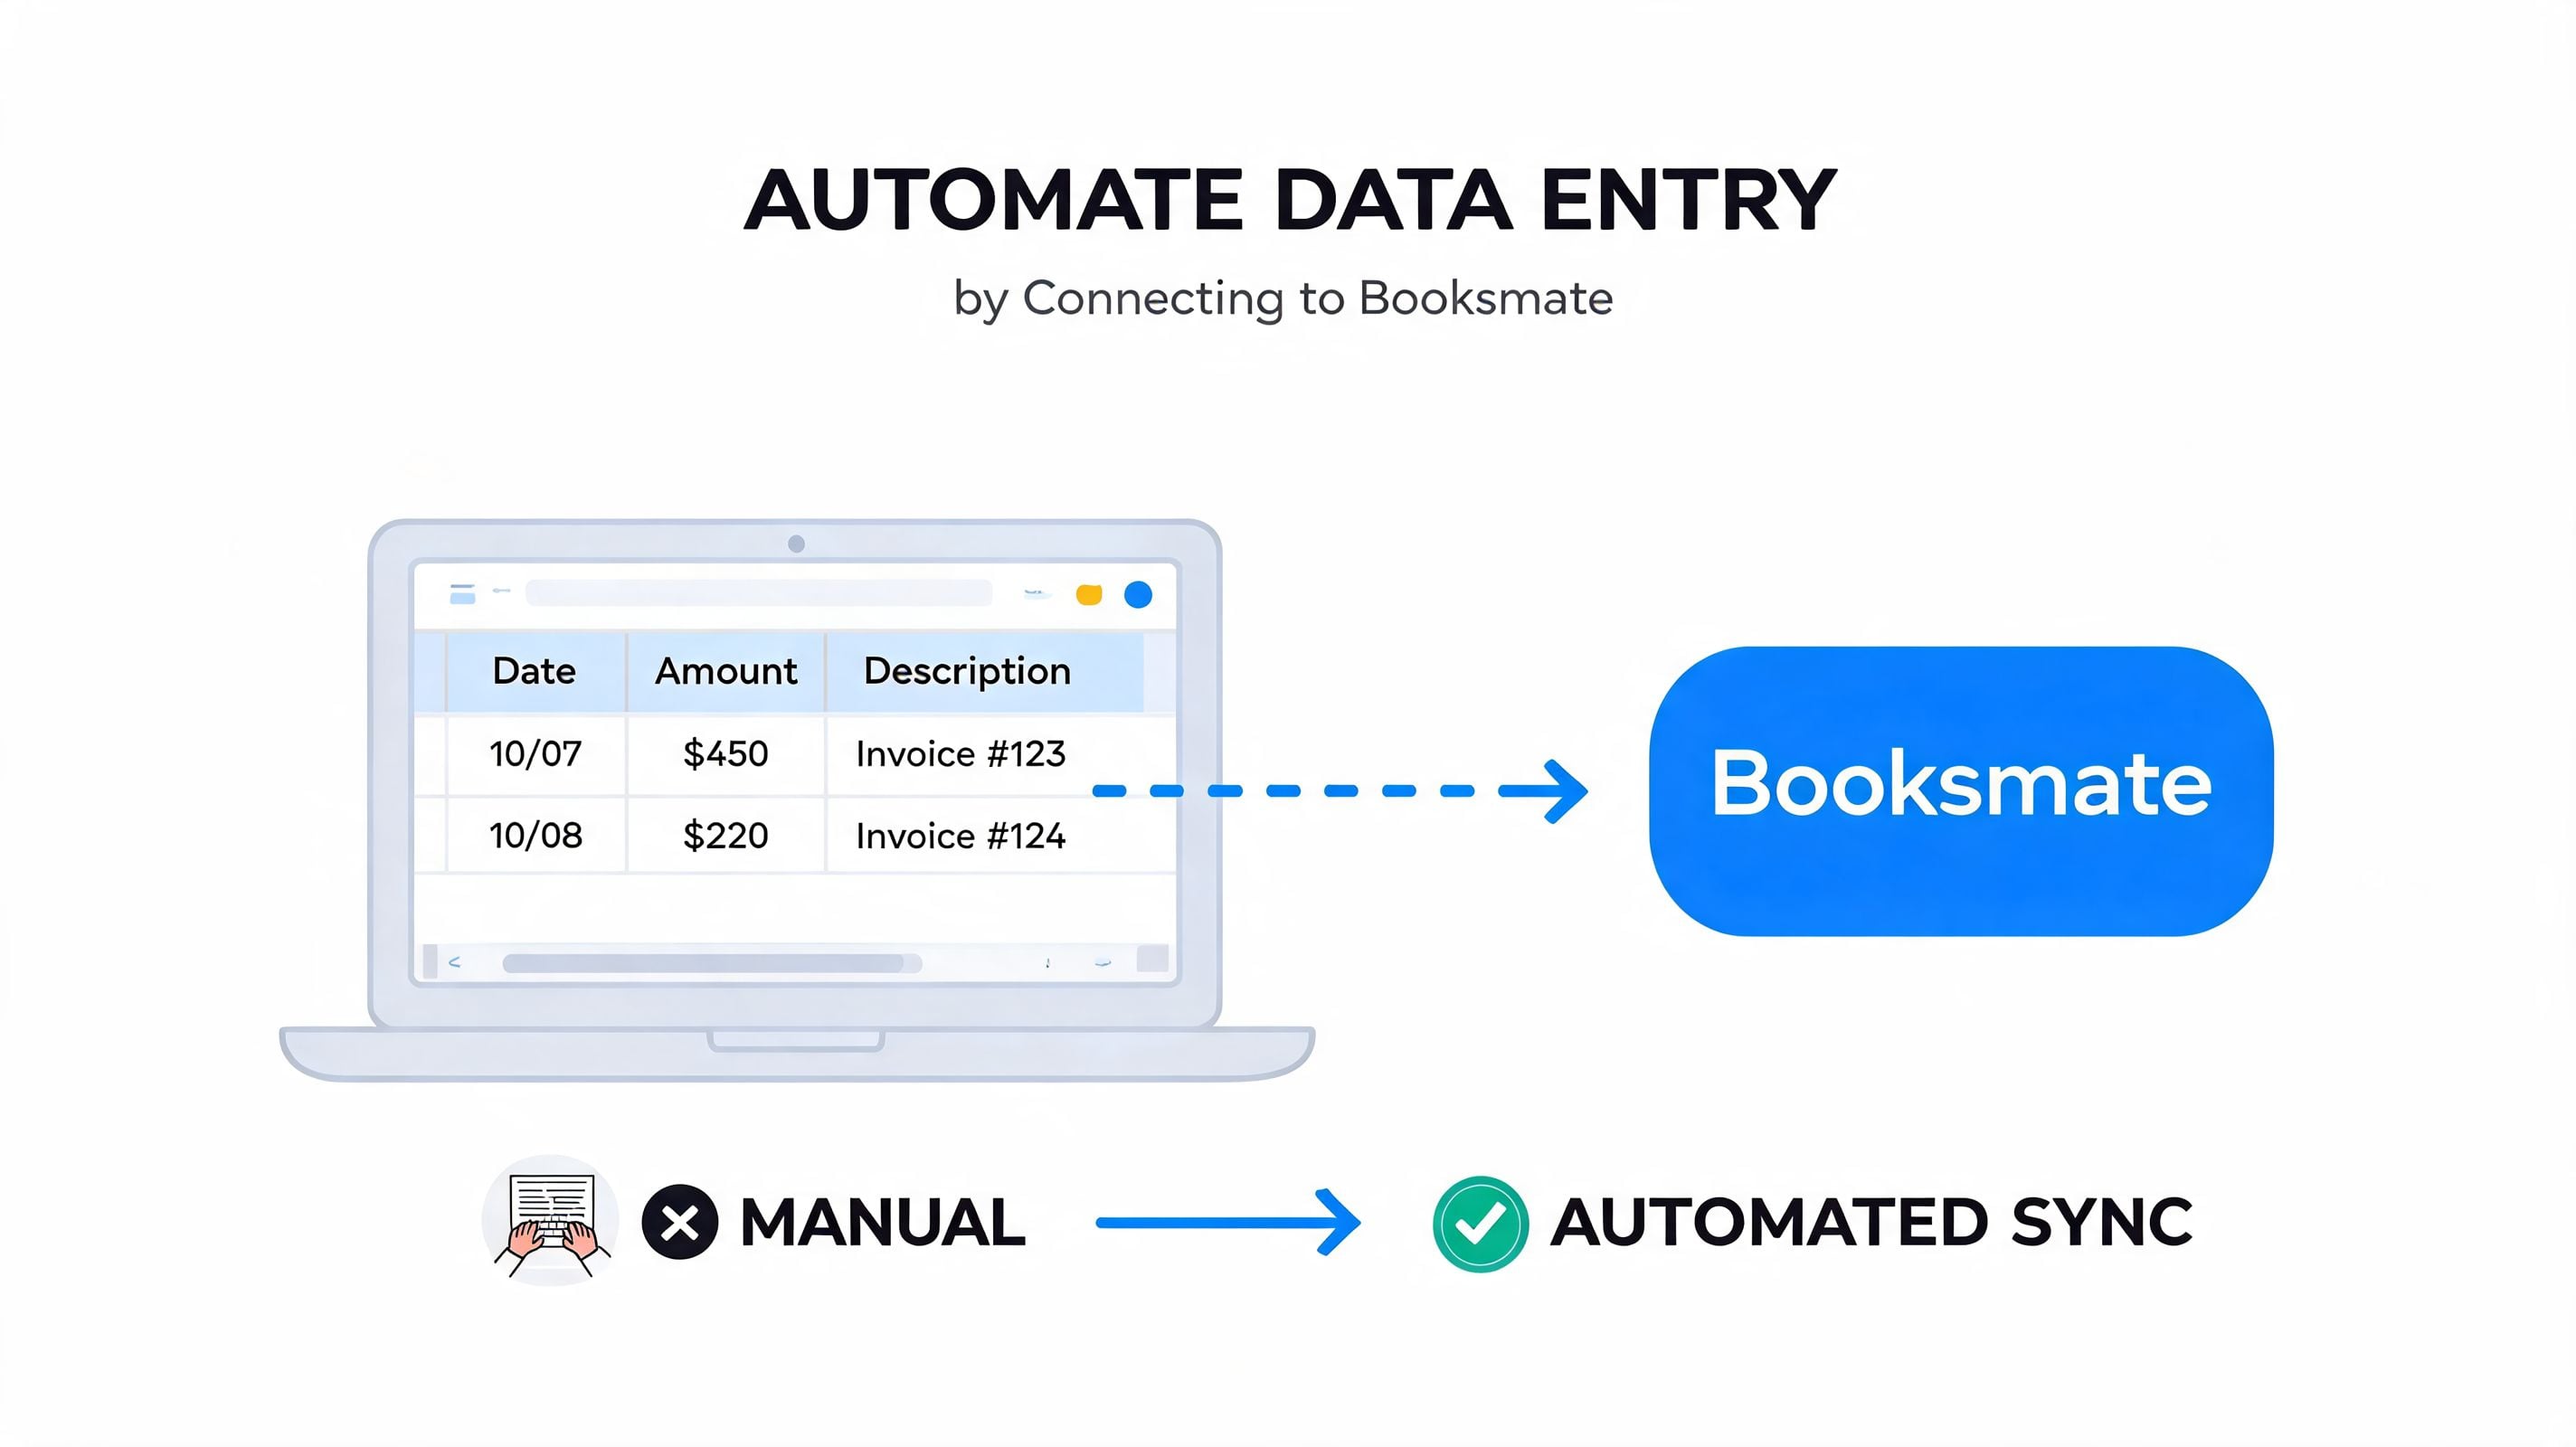
The practical fix isn’t to throw away Excel. It’s to stop using Excel for the part it’s worst at, which is document chasing. Let another system gather the source documents, then use your spreadsheet as the review and reporting layer.
A better hybrid workflow
This is the setup that makes sense for many bookkeepers and finance teams:
Collect invoices and receipts automatically from portals and inboxes.
Extract the key fields into structured data.
Export a clean CSV from the document system.
Paste or import that CSV into your Excel entry sheet.
Refresh your formulas and PivotTables.
That approach keeps the familiar flexibility of an excel template expense tracker while cutting down the repetitive admin work that usually causes spreadsheet neglect.
Why this bridge matters
Manual entry isn’t just slow. It also creates inconsistency. One person types “MSFT,” another writes “Microsoft,” and someone else leaves the vendor blank. Receipts go missing. Dates get entered in mixed formats. Good dashboards start with clean source data, and source data usually breaks down at the collection stage.
If you’re trying to reduce that friction, it helps to study broader strategies for data automation so you can decide which tasks should stay manual and which should be delegated to a collection layer.
Here’s the key distinction:
Excel is excellent at organizing, summarizing, and reviewing
Document automation is better at fetching and extracting
The combination works better than forcing one tool to do both
The smartest spreadsheet workflow is often semi-automated, not fully manual.
Keep the import process simple
When you bring exported CSV data into Excel, match it to the same columns you already use in the template. Don’t redesign the workbook every time your import format changes. Standard columns make ongoing maintenance easier.
A practical import checklist:
Check date formatting first: Mixed date formats create messy monthly summaries.
Map categories consistently: If imported categories don’t match your dropdown list, standardize them before final reporting.
Review descriptions: Clean vendor names save time later.
Use a staging tab if needed: Import raw CSV data into one sheet, then move approved rows into the main tracker table.
This is the point where many teams realize their spreadsheet wasn’t the problem. The bottleneck was gathering the documents in the first place. Once that work is reduced, Excel becomes much more effective.
Troubleshooting Common Issues and Pro Tips
Most spreadsheet problems aren’t dramatic. They’re small annoyances that pile up. A formula breaks after a row is inserted. A PivotTable doesn’t show the latest expenses. The file gets slower as more months are added.
Those are fixable if you know where to look.
When formulas start showing errors
If you see #REF!, a referenced cell or range was likely moved or deleted. If you see #VALUE!, Excel is usually trying to calculate with text where it expects a number or date.
A quick triage routine helps:
Check the source range: Make sure the formula still points to the right columns.
Look for text in amount cells: A stray note or symbol can interrupt the calculation.
Test one row manually: If one row works, compare it to the broken one.
Review locked references: If copied formulas shifted unexpectedly, the cell references may need
$locks.
Don’t fix these by rewriting everything. Trace the first broken point, correct it there, and copy the corrected formula only after you’ve confirmed the result.
When the PivotTable won’t update
A stale PivotTable usually means one of two things. Either the source data isn’t part of the Excel Table, or the report just needs a refresh.
Use Data > Refresh All after adding new entries or imports. If the latest rows still don’t appear, confirm that your PivotTable source is tied to the full Table and not to an older fixed range.
If your report stops updating, check the source before blaming the chart.
Also watch your dates. If the date column contains mixed formats, month grouping can look wrong even when the numbers are technically present.
A few habits that save time
The best pro tips are boring. They’re the ones that keep the file usable month after month.
Freeze the header row: It keeps column names visible during long reviews.
Use filters constantly: Filters surface duplicates, uncategorized rows, and vendor inconsistencies quickly.
Apply conditional formatting carefully: Highlight large expenses, missing categories, or blank payment methods.
Archive by year if needed: If the workbook gets heavy, move closed periods into a separate file and keep the current year active.
Keyboard shortcuts help too, especially for repetitive cleanup. But the bigger win is process discipline. A plain workbook maintained weekly is more valuable than a complex one touched once a quarter.
If your tracker keeps breaking, simplify it. Reduce extra tabs, remove decorative formulas, and focus on one clean entry table, one summary area, and one dashboard. That structure lasts.
If you’re tired of chasing invoices across vendor portals and email threads, Booksmate is worth a look. It helps bookkeepers and finance teams collect documents automatically, extract the key data, and export it into the systems they already use, including the kind of Excel workflow covered here.
When a spreadsheet no longer fits the process, consider business expense tracking software for a more scalable workflow.
To pair expense reporting with profitability analysis, review gross margin formulas in Excel for the core calculations.
For profitability reporting, what is the difference between gross margin and markup in excel explains the key distinction.